Archive for the ‘Uncategorized’ Category

Did West Africa’s Ebola Outbreak of 2014 Have a Lab Origin? Most likely.

July 14, 2023

US Lab in Kenema Sierra Leone; Ft Detrick and Metabiota Possible Roles. 2023-07-14

Main Man

by Sam Husseini and Jonathan Latham, PhD

Between 2014 and 2016, West Africa endured an Ebola epidemic that was easily the largest and deadliest in history. Over 29,000 people were infected and more than 11,000 died in what was also an economic and social calamity.

The countries most afflicted were Sierra Leone, Liberia, and Guinea; but lives were also lost far afield. Ebola cases were detected in Nigeria, Senegal, Mali, Spain, the UK, and the U.S. This international spread unleashed its own, albeit fairly short-lived, panic.

The infectious agent that caused the outbreak was a filovirus, the Zaire species of Ebola virus (sometimes called ZEBOV and sometimes just Ebola), which has a fatality rate of up to 90 percent (Feldmann and Geisbert, 2011).

The orthodox story of the outbreaks’ origin remains the one given at the time by the global media. In the U.S., the Atlantic ran “The Beautiful Tree, the Bats, and the Boy Who Brought Ebola.” The UK Independent led with “Ebola outbreak: Two-year-old boy from tiny Guinea village was first to be infected after playing with bats in tree stump.” The BBC filed: “First Ebola boy likely infected by playing in bat tree” and Canada’s Toronto Star informed its readers “Scientists trace Ebola outbreak to a tree where children play“. While disagreeing whether it was a “stump” or a “beautiful tree”, the media all concurred on one African boy and the bats.

The primary source for these accounts was a research paper that appeared on December 30th, 2014 in the journal EMBO Molecular Medicine (Saéz et al., 2014). Titled “Investigating the zoonotic origin of the West African Ebola epidemic“, the paper begins:

“The severe Ebola virus disease epidemic occurring in West Africa stems from a single zoonotic transmission event to a 2yearold boy in Meliandou, Guinea.”

Their claimed patient zero, Emile Ouamouno, allegedly caught Ebola after playing with, or maybe hunting, bats.

Perhaps dissuaded by the definitive opening sentence, the media seems not to have enquired at the time into what evidence supported this narrative. This was perhaps a mistake.

Granted, there seemed grounds for confidence in these scientists. The senior author was Fabian Leendertz of the prestigious Robert Koch Institute in Germany. Leendertz is a renowned virus hunter best known as a member of the WHO team that reported, in March 2021, on the origins of COVID-19.

Missing evidence: the search for a zoonosis in Meliandou

For their investigation, the Leendertz team surveyed bats in the area surrounding Meliandou. Bats were chosen since they were considered the presumptive reservoir host of Zaire Ebola viruses (Leroy et al., 2005; Leroy et al, 2009; Pigott et al., 2014).

Samples of bat blood and bat tissue were collected from 159 individuals of 13 bat species. However, the results were uniformly negative:

“No EBOV RNA was detected in any of the PCR-tested bat samples [and] attempts to demonstrate the presence of IgG antibodies against Ebola viruses were inconclusive (data not shown).”

Trying another tack, the authors knew that outbreaks of Zaire Ebola are sometimes correlated with mass die-offs of forest mammals (Walsh et al., 2003; Leroy et al., 2004). However, no evidence for mammal declines could be found near Meliandou:

“[these results] suggest they have not experienced a major decline; in fact, carnivore and chimpanzee (Pan troglodytes verus) populations may have increased.

All-told, the Leendertz team found no sign whatever of Ebola in the area around Meliandou.

What of Emile? The Leendertz team concluded that Emile and his mother, who was eight months pregnant at the time, were both Ebola victims, as was a sister who also died. They did not note, however, that Emile’s primary caregiver at the time (probably because of the pregnancy) was his father, who never became sick.

Moreover, no blood or other samples were ever taken from any of these suspected cases. Hence no laboratory evidence exists for any of them having had Ebola and so these diagnoses rest on symptoms alone.

This is highly significant because the symptoms of Ebola are very variable. Even when severe, they overlap with many diseases that are common in West Africa, including malaria, cholera, and Lassa fever. It is therefore generally agreed that Zaire Ebola cannot be diagnosed without genome sequencing or other lab tests (Gire et al., 2014). These tests were not available until much later in the outbreak.

Thus the Leendertz investigation detected no Ebola in bats or other animals in the vicinity of Meliandou, nor did they uncover any other evidence that an Ebola outbreak had occurred in the region. They also found no evidence that Emile or his immediate contacts had Ebola infections; nor even was there a clear indication that Emile had any contact with a bat or the now infamous tree. Such findings did not warrant anything like the absolute certitude of the opening sentence of their report.

Rather, the evidence collected by the Leendertz team was, if anything, against Ebola having been in Meliandou at that time.

Independent evidence against Ebola in Meliandou

Chernoh Bah, an independent journalist from Sierra Leone, wrote a book on the 2014 Ebola outbreak and visited Meliandou. Bah found that:

“Local health workers still think malaria may have been the actual cause of his [Emile’s] death.”

While in Meliandou, Chernoh Bah also interviewed Emile’s father. According to Bah, the Leendertz team (who never claimed to have interviewed the father) made a crucial error:

“The child was actually 18 months old when he died.”

Bah confirmed this assessment in an interview with Independent Science News. This age is also accepted by the US CDC and was independently confirmed by Reuters journalists, who also interviewed Emile’s father. The age question, it should be noted, is crucial to the entire outbreak narrative. As Emile’s father told Reuters:

“Emile was too young to eat bats, and he was too small to be playing in the bush all on his own. He was always with his mother.”

Bah also identified another apparent error: that Emile had four siblings who never became sick. These siblings are not mentioned anywhere in the scientific literature.

The wider context is also important for weighing these contending accounts. Some previous outbreaks of Zaire Ebola have been linked with hunting, but only once has an Ebola outbreak been linked to handling or consumption of bats, and then only tentatively (Leroy et al., 2009). Thus, although catching and eating bats is common in parts of Africa, a clear precedent for their passing Ebola to humans does not exist.

Further, although some bats appear to carry antibodies against Ebola viruses, only intact Bombali Ebola (a different virus species in the Ebola genus) has ever been isolated from a bat, despite intensive searches (Leroy et al., 2005; Pigott et al., 2014; Goldstein et al., 2018; Forbes et al., 2019). Bombali is a species of Ebola that does not infect humans.

Taken together, this suggests that bats rarely carry Ebola viruses and when they do it is in small quantities. This context makes it somewhat surprising that Saéz et al. ascribed the 2014 outbreak (without supporting evidence) to contact with bats. Indeed, Fabian Leendertz now doubts that bats are true reservoirs of Ebola viruses (Leendertz et al., 2016).

Given the general want of evidence, one wonders by what exact process such poorly supported claims were transmuted into international headlines.

The missing epidemiology connecting Emile to the first proven Ebola cases

Emile Ouamouno died in Meliandou, Guinea, on Dec 6th, 2013 (Saéz et al. 2014; Baize et al., 2014).

Political map of Guinea, Sierra Leone and Liberia. The arrows point to Meliandou and Kenema

Relying on hospital records and interviews, a putative transmission chain connecting Emile to (most of) the earliest confirmed cases was published in the New England Journal of Medicine (Baize et al., 2014).

The proposed epidemiological chain is shown in full in figure 2 (reproduced from Baize et al., 2014). In figure 2, suspected cases are indicated by an ‘S’ while patients confirmed by laboratory test are denoted with a ‘C’ for ‘confirmed’ (and also given a red spot). This makes Emile ‘S1’ in the standard narrative.

screen shot
Fig 2 The putative Ebola infection chain (from Baize et al., 2014 NEJM 371:1418-1425)

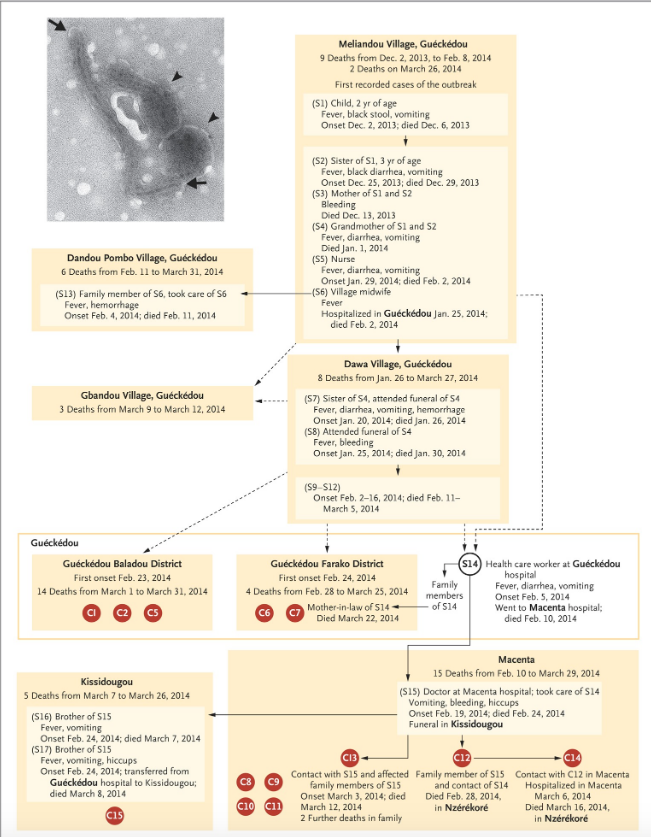
These authors acknowledge that the dashed connections in figure 2 represent epidemiological links that “are not well established”. It is thus important to note that Emile connects to the first confirmed cases only via dashed lines.

The next thing to understand about the standard epidemiological account is that laboratory tests for Ebola disease only became available in West Africa on March 21st, 2014. Every step in the infection chain in figure 2 (except when C12 infected C14) relies on symptoms alone. Thus even the solid lines in figure 2 are highly provisional too.

The third important consideration is that there are two alternate versions of Baize et al. 2014 available online. The version initially published by the NEJM is represented by figure 2. The version available now (dated July 12, 2022) on the NEJM website states that the first (peer-reviewed) version of the article was “preliminary”. The major change in the final text was to state that a second epidemiological investigation concluded death dates for S1 (Emile), S2, S3 and S4 were later by up to 3-4 weeks (Baize et al., 2014). However, no information about this second investigation is provided. There is no explanation for why it was necessary and it contradicts figure 2 (which remains unchanged in the new version of the paper). It is also never stated which of the two conclusions, if any, the authors themselves favour.

(Potentially, this second investigation was the one conducted by the Leendertz team and noted in Saéz et al., 2014. These researchers claimed that the first Baize investigation was incorrect and that Emile (S1) died on Dec 28th (not December 6th) and his sister on January 5th (not December 29th) and his mother (S3) on January 11th (not December 13th). However, Saéz et al. do not mention revising the death date of the grandmother (S4) which Baize et al. state was revised in the second investigation from January 3rd to an unspecified date.)

This epidemiological uncertainty manifests even at later dates and among confirmed cases. For example, figure 2 does not include patient C3, who was the first confirmed Ebola death (on March 17th) at Guéckédou hospital. This is the nearest hospital to Meliandou, 12 km away. Nor was a chain established for one of the next two deaths (C4 on March 18th) at Guéckédou hospital (both are therefore only noted in Table 1 of Baize and not figure 2).

This insufficiency of concrete data surrounding the very early cases, plus the lengthy time interval separating Emile’s death in December from the first confirmed cases in mid-March and the delayed subsequent investigations cast considerable doubt on the validity of the whole chain.

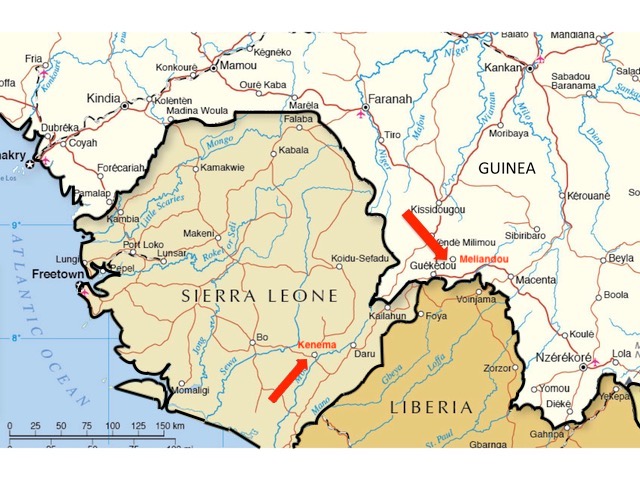
There are other problems too. As can be seen in figure 2, if we consider only the first cases confirmed by laboratory tests, the earliest deaths were not recorded at Guéckédou hospital at all. Despite being labeled with higher numbers (as if they were later in the outbreak), the four earliest deaths among confirmed cases were C12 (d. Feb 28th), C13 (d. March 12th), C8 (d. March 16th), and C14 (d. March 16th). These patients all presented at Macenta hospital which is over 100 km east of both Meliandou and Guéckédou (see figure 1, above).

This pattern among the earliest confirmed deaths does not obviously suggest an epicentre in Meliandou. So, although Baize et al. conducted epidemiological investigations, this rooting of the outbreak is, in reality, highly provisional.

Last, but perhaps not least, since the diagnoses are mostly unconfirmed, the credibility of the epidemiological chain in figure 2 rests heavily on the researchers’ claims to have interviewed eyewitnesses, yet Emile’s father contradicted them in 2015, telling Reuters:

“It wasn’t Emile that started it”.

Zaire Ebola in 2014: the prima facie case for a lab origin

After Ebola was first confirmed by laboratory tests in mid-March 2014, persistent rumours in the region linked the outbreak to a US-run research laboratory in Kenema, Sierra Leone (Wilkinson, 2017). This facility studies viral hemorrhagic diseases, of which Ebola is one.

Kenema is 140 km southwest of Guéckédou and the same distance from Macenta and a little farther from Nzérékoré (see figure 1, above). All these towns sit close to or fairly close to the border where Guinea, Sierra Leone and Liberia meet.

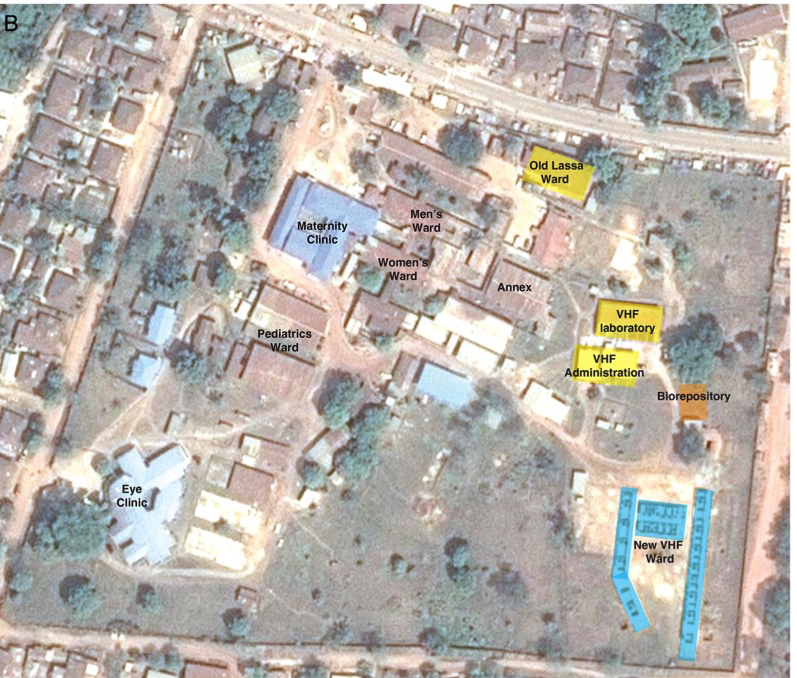
The Kenema laboratory stands in the grounds of the Kenema Government Hospital (KGH). The lab, but not the hospital, has been operated by the US-based Viral Hemorrhagic Fever Consortium (VHFC) since 2010. Though there is an interesting continuity–a viral hemorrhagic fever laboratory was run by the US CDC in Kenema between 1976 up to Sierra Leone’s civil war in the 1990s.

The KGH compound and the VHFC buildings
Fig. 3. The KGH compound and the VHFC buildings around 2015. The biorepository and the new VHF ward buildings were proposed only (Credit: Goba et al., 2016)

The president and founder of the VHFC is virologist Robert (Bob) Garry of Tulane University.

In response to lab origin speculation, Garry gave a curious denial of any connection to his lab in an interview with Politifact published on 15 October, 2014, titled “5 falsehoods about Ebola“. Garry told his interviewer, Aaron Sharockman:

“We were there working 10 years and then Ebola came here.” 

The possibility of a lab origin never gained much attention outside Africa. But the 2014 Ebola outbreak was enigmatic on several key grounds.

One puzzle was noted by the Leendertz group:

“[The] current epidemic represents the first proven emergence of Zaire Ebola virus in West Africa.” (Saéz et al., 2014)

The Zaire species of Ebola is the most lethal (to humans) of all the members of the Ebola genus. This genus also includes other Ebola-like viruses: Bundibugyo virus, Tai Forest Virus, Reston Ebola, Bombali Ebola, and Sudan Ebola. As its name implies, all prior outbreaks of Zaire Ebola were in the central African equatorial zone (the Congo basin) (Feldmann and Geisbert, 2011). At its closest, this classical Zairean Ebola zone is 3,000 km from Guinea. Hence Zaire Ebola’s appearance in West Africa was a striking and very unexpected development.

How might it have reached West Africa? Ebola is not highly contagious. Transmission normally requires direct contact with the body fluids of an infected host. With such weak infectious properties and poor spreading potential, how could it move so far? Moreover, although often lethal and hence relatively easy to spot when it emerges, the virus caused no known human or animal outbreaks en route from its traditional Congo refuge.

A second major puzzle is that subsequent genome sequencing and phylogenetic analysis has shown unambiguously that the 2014 outbreak resulted from a single jump into humans (Gire et al., 2014; Dudas and Rambaut, 2014).

Zoonotic outbreaks, including most past Ebola outbreaks, typically feature multiple jumps to humans from an animal source (Feldmann and Geisbert, 2011). Single jumps, however, are consistent with lab origins and are often considered a red flag for that possibility (Nakajima et al., 1978). The reason is that researchers often work with a single isolate, perhaps one that they have found is particularly easy to replicate in the laboratory, whereas natural populations are typically diverse. This difference provides a genetic signal for distinguishing natural origins from laboratory ones.

Last, Zaire Ebola is the species favoured by civilian and military research labs for studying Ebola-type viruses. It is their focus because of its high mortality rate and thus biowarfare potential.

Journalist Chernoh Bah is now a graduate student at Northwestern University. Noting the gap between the weakness of the Leendertz account of the outbreak origin (and we would add that of Baize too) and the forcefulness with which the Emile narrative was asserted by western scientists and western media, he wrote:

“it is difficult not to interpret the ‘zoonotic origin of the West African Ebola epidemic’ narrative advanced by Fabian Leendertz and his team as part of a cover-up or obfuscation of the actual chain of events that laid the foundation for the West African Ebola outbreak.” (Chernoh Bah, The Ebola Outbreak in West Africa)

Indeed, the Kenema laboratory merits close inspection as a potential source of the Zaire Ebola strain that led to the 2014 outbreak.

Did the Viral Hemorrhagic Fever Consortium study Ebola at Kenema?

According to its website, the Viral Hemorrhagic Fever Consortium is a collaborative project for the study of hemorrhagic fevers and their treatments. Lassa virus, which is common locally, and the Ebola viruses are the most prominent viral hemorrhagic diseases. The consortium’s only permanent site is at Kenema.

Prominent institutional members of the VHFC include labs from Harvard University, the Broad Institute of MIT and Harvard, Scripps Research of San Diego, and Zalgen, a diagnostics company founded by Robert Garry. Though not currently listed as such, in 2014, Metabiota, the self-described “pandemic threat management” company was a VHFC partner as have been other companies.

Like Garry, the other VHFC leadership is US-based and includes Kristian Andersen of Scripps Research, Erica Ollmann Saphire, and Pardis Sabeti (Board Treasurer). Garry and Andersen are currently highly visible due to their numerous media appearances and scientific articles dismissing SARS-CoV-2 lab-origin hypotheses as baseless conspiracies (e.g. Andersen et al., 2020; Worobey et al., 2022).

In 2011, three years before the West African Ebola outbreak, Reuters profiled the research in Kenema at length. Readers were told that a “laboratory in southeastern Sierra Leone is an outpost of the U.S. government’s ‘war on terror,’ funded by a surge in bio-defense spending since the airplane and anthrax attacks on New York and Washington a decade ago. American research aims to limit the vulnerability of western interests to biological agents.”

As Reuters noted: “In 2001 — prior to the September 11 attacks — the U.S. National Institutes of Health budget for bioterrorism and related research was $53 million. But by the fiscal year 2007 the NIH was requesting more than $1.9 billion.” Reuters concluded that the Kenema labs’ share of that allocation was $40 million.

On August 25, 2013, just months before the Ebola outbreak, the VHFC posted on its website an article titled: Researchers at the Scripps Research Institute make major advances in the fight against Ebola virus.” This article was later removed but its existence is verifiable using the WayBackMachine. Nevertheless, the title alone raises some key questions: Why did the VHFC post about Ebola if it wasn’t working on it at the time? In particular, what Ebola variant was being studied? What was the nature of the experiments? Why remove the post?

This was not the only time the VHFC appeared to be steering perception of its research towards Lassa fever and away from Ebola in the wake of the outbreak. On May 27th, 2014, a VHFC statement appeared that referred to the “current Ebola Epicenter of Guéckédou, Guinea” and the collaboration with Metabiota. The statement referenced their “Lassa laboratory at Kenema Government Hospital (KGH)”. This is the first reference we have been able to find of the VHFC calling its facility at Kenema the “Lassa Laboratory”. This may be an understandable rhetorical effort to distance themselves from Ebola research. But it raises the question: if the work at Kenema was only on Lassa, why was the generic term “hemorrhagic fever” used for the consortium (and previously the lab), if not to encompass research on related viruses? And were such large funding amounts simply for Lassa fever?

We do know that Ebola was important to the VHFC and its partners and a primary interest for at least some of its members.

Indeed, all the leading US-based researchers of the VHFC, Robert Garry, Kristian Andersen, Erica Ollmann Saphire and Pardis Sabeti have published multiple original research papers on Ebola virus (e.g. Lee et al., 2008; Koehler et al., 2013; Murin et al., 2014; Guha et al., 2018; Gunn et al., 2018; Barnes et al., 2020).

An Ebola focus also accords with US biosecurity research priorities under whose auspices the Kenema lab is largely funded. While Lassa fever is an endemic and sometimes debilitating illness, Ebola is a mysterious but highly lethal pathogen associated with the very highest level of biosecurity concerns.

Two exemplars are of this personal interest in Ebola are Erica Ollmann Saphire and Thomas Geisbert.

Erica Ollmann Saphire
Erica Ollmann Saphire is a VHFC board member from the La Jolla Institute for Immunology in San Diego. Saphire’s main research focus is Ebola. In January 2013, for instance, a lengthy and hyperbolic profile of her was published by Gary Robbins of the San Diego Union-Tribune: “The Virus Hunter: Erica Ollmann Saphire takes on deadly threats.”

The piece begins: “Deep in the thicket of west Africa, on a bamboo bridge strung over raging waters, Erica Ollmann Saphire groped through the dark toward a village where pestilence can snuff out life with ruthless efficiency. She was looking for rodents. The Scripps Research Institute biologist wanted to know how and where her enemy spreads viral hemorrhagic fever: things like Ebola and Lassa, diseases that can kill.”

The piece notes that Saphire was working on a “species of Ebola” which is “50-90 percent lethal.” This part is not hyperbole­–since 2006 Saphire has co-authored over 30 publications on Zaire Ebola virus, testament to a longstanding research interest (e.g. Bornholdt et al., 2013).

Thomas Geisbert and the Failed Clinical Trial of TKM-Ebola
Another example is Thomas Geisbert. Geisbert is now at the University of Texas Medical Branch, but formerly he was at the United States Army Medical Research Institute of Infectious Disease (USAMRIID) in Maryland, also known as Fort Detrick. It is the premier US “biodefense” facility.

On Dec. 14, 2014, Andersen published a post on the VHFC website celebrating Time magazine’s choices of “VHFC researchers Drs. Pardis Sabeti and Thomas Geisbert” as “Ebola Fighters” and two of their people of the year.

Geisbert’s 2014 Time profile is informative. Citing Soviet defector Ken Alibek as his authority (even though Alibek was, by then, widely considered an unreliable source), Geisbert told Time readers that the Soviet Union had tried to weaponize Ebola. While at Fort Detrick, Geisbert and his colleagues had pushed for a US response to Alibek’s allegations:

[at that period there] “wasn’t money or interest or time to take those products across the finish line.” “But after 9/11, everything changed. There was increased funding. It was fortunate for me, because Ebola was my main area of interest. When all the money became available, we started looking at developing a vaccine. The idea came from Heinz Feldmann, then at the Public Health Agency of Canada (now at the National Institute of Allergy and Infectious Diseases), and the first big success we had was in 2002 or 2003. We did two back-to-back studies, and this was the first vaccine that completely protected monkeys from Ebola.”

Geisbert’s research was detailed further by Constantine Nana, who wrote a book about the 2014 outbreak: The Ebola Outbreak in West Africa. In the book Nana wrote:

“[Geisbert] has studied the Ebola virus for more than two decades and spent several years working with the United States Army Medical Research Institute of Infectious Disease at Fort Detrick. In March of 2014, he was awarded (together with Profectus Biosciences, Tekmira Pharmaceuticals, and Vanderbilt University Medical Center) $26 million (to be distributed over five years) by the NIH to ‘advance treatments of the highly lethal hemorrhagic fever viruses Ebola and Marburg.’

In his book, Nana speculated that such research might have led to a leak at Kenema.

In particular, Nana cites a product called TKM-Ebola, an RNA-based therapeutic that, according to research published in the Lancet, was a 100% effective treatment for primates infected with Ebola (Geisbert et al., 2010). The Lancet work was funded by the Defense Threat Reduction Agency (part of the Department of Defense), it involved the Zaire Ebola strain, and was a collaboration involving Geisbert and Tekmira Pharmaceuticals.

In his Time magazine profile, Geisbert heralded the success he and Tekmira were allegedly having:

“I’ve got shelves and shelves and shelves and shelves of stuff that slow or inhibit growth of Ebola in culture. Dozens of those protect mice or guinea pigs. Only two worked in nonhuman primates, out of all the studies done in the BSL4 lab — and those are ZMapp done by Gary Kobinger in Canada and TKM-Ebola, which I worked on with biotech company Tekmira. … When you do have success, like when we did the TKM-Ebola study, there is no greater feeling.”

Based on the Lancet result, Tekmira raised at least $140 million from military-related funders. This allowed them, around the time of the outbreak, to run a series of Phase I and Phase II clinical trials of different versions of TKM-Ebola.

For instance, on Dec. 13, 2013, Tekmira announced a study in humans and on Jan. 14, 2014, wrote a further press release, titled “Tekmira Doses First Subject in Human Clinical Trial of TKM-Ebola”. As reported by the New York Times in June 2015, at least one phase II trial was definitely conducted in Sierra Leone. Funded by the UK’s Wellcome Trust, this one was halted because, according to Tekmira, the drug was “not likely to demonstrate an overall therapeutic benefit”.

This trial was later published in a scientific journal and described as occurring at Port Loko, 190 km northwest of Kenema (Dunning et al., 2016).

From the limited descriptions available, one of these trials fits the timing required for it to have triggered the 2014 Ebola outbreak but none of them fits the location. However, the data is incomplete; for his book, Constantine Nana corresponded with the lead investigator in the Port Loko Phase II trial, Dr. Peter Horby of the University of Oxford.

Horby told Nana “he had no information as regards the results of the Phase I trial.” To lead a Phase II trial and know nothing about that product’s Phase I trial is indeed mysterious and rather strange.

Soon after, in July 2015, Tekmira changed its name and ended its quest for an Ebola treatment.

At a minimum, these activities demonstrate the very active nature of Geisbert’s interest in Ebola virus and cause one to wonder about the sudden ending of Tekmira’s interest in Ebola after such a promising beginning. And it further raises the possibility that experiments might have been conducted at Kenema that did lead to an outbreak. For instance, perhaps live Ebola virus from unpublished sources was cultured alongside other reagents for these trials?

Other VHFC members
Pardis Sabeti, one of Time magazine’s “Ebola fighters” is a prominent researcher at the Broad Institute and is VHFC’s treasurer. A press release from the Vilcek Foundation on Jan. 29, 2014 states that she:

“has studied several agents that cause infectious diseases, such as the malaria parasite, Lassa virus, and Ebola virus.”

In 2013 Robert Garry co-authored a paper on a novel treatment for Zaire Ebola (Koehler et al., 2013). All eleven other authors were from USAMRIID, aka Fort Detrick. This site is the largest “biodefense” facility in the world and Garry’s company, Zalgen, is located close-by.

Other commercial research at the Kenema laboratory
In 2010, Corgenix, another “partner” of the VHFC, published a news release: “Corgenix Awarded NIH Grant to Develop Next Generation Technology Detection Products for Ebola and Marburg Viruses.” The release stated: “Collaborating with Corgenix on the study will be Tulane University, The Scripps Research Institute and Autoimmune Technologies, LLC.” Autoimmune Technologies has also been a VHFC partner.

“We expect this study will result in specific, cost-effective and easy to use tests for Ebola and Marburg virus detection,” said Jon Geske, Ph.D., Corgenix Project Director and Principal Investigator of the program. “In addition, the resulting diagnostics will be critical for development of vaccines and other treatments for these currently incurable diseases.”

“Building on our very successful Lassa virus program, this will enable the development of state-of-the-art diagnostic tests for Ebola and Marburg viruses on multiple delivery platforms.” added Douglass Simpson, Corgenix President and CEO.

The 2010 Corgenix news release also quotes VHFC President Robert Garry:

“We have been very pleased with the results of our collaborative effort over the past five years. The diagnostic products for Lassa have shown to be remarkably effective in clinical settings in Africa and will have a meaningful impact on the healthcare in that part of the world, and will also fill a critical gap in bioterrorism defense. Now, under the new NIH grant, we will expand this program to address these additional infectious agents that have the potential to kill hundreds of thousands of people and are of concern to the public health and bioterrorism preparedness communities.”

This represents a further example of potentially highly relevant research (since to detect Ebola one usually needs Ebola) being conducted with members of the VHFC, quite possibly at Kenema.

Biosafety lapses at the Kenema lab

Studying viral hemorrhagic fevers is considered dangerous work. In the U.S., using live filoviruses requires biosafety level four (BSL-4) facilities, where researchers wear positive pressure ‘space suits’.

But in Kenema, also according to Reuters, biosafety “measures include goggles, gloves and masks.” The article quoted VHFC member Matt Boisen, a U.S. scientist from Tulane, now with Zalgen:

“Certainly we have less safety, less containment, but we do have the ability to do a lot more in the same amount of time.”

Apparently, lax biosafety protocols provided an incentive to work at Kenema.

In 2016 the Associated Press (AP) conducted a post-epidemic investigation into the Kenema lab and its role in the response. AP was told by an anonymous source that, at the Kenema lab, “used needles litter the place”.

AP also obtained internal WHO emails in which senior WHO official Pat Drury told WHO director Margaret Chan:

“Both labs [Tulane and Metabiota at Kenema] do not meet international standards for biosecurity.”

Others have corroborated this laxity. In the 2014 outbreak, the earliest emergency responder was the medical non-profit Doctors Without Borders (MSF) who were called in for their extensive Ebola experience.

MSF’s emergency response coordinator was Anja Wolz. She was highly critical of the biosafety measures used by Metabiota at Kenema. Having seen how they visited suspected Ebola cases, she told AP:

“I didn’t go inside the Metabiota lab…..I refused because I had already seen enough”

A CDC official, Austin Demby, later sent to investigate, reached similar conclusions. In an email about the Kenema lab he wrote:

“The cross contamination potential is huge and quite frankly unacceptable.”

Thus, there seems to have been a pattern at Kenema of lax biosafety procedures both before and during the outbreak.

MSF alleges a hidden outbreak in Sierra Leone

Responding to international emergency requests to attend an outbreak of then unknown cause, MSF arrived in Guéckédou, Guinea, on March 18th, 2014. It was their diagnostic efforts that first confirmed the presence of Ebola.

After the outbreak had waned, MSF wrote a report on the Ebola outbreak response that was highly critical of members of the VHFC.

The MSF report refers to their early suspicions that, despite the absence of positive test results from Sierra Leone, Ebola was nevertheless present:

“The detective work of the epidemiologists revealed some unconnected chains of transmission in different locations in the Guinée forestière region, many of whom had family in neighbouring Liberia and Sierra Leone.”

The report also cites Dr Armand Sprecher, MSF public health specialist:

“The problem initially was not so much the number of cases, but that the hot-spots were spread out in so many locations,”

In other words, the outbreak in Guinea did not resemble a recent outbreak with a simple epicentre, as proposed by the Leendertz and Baize papers. Instead, what MSF found when they arrived in Guinea were many cases, widely dispersed, at least some of which appeared to originate from neighbouring Sierra Leone.

This raised a further question:

“Meanwhile, there was concern all along about the puzzling absence of confirmed cases over the border in Sierra Leone.”

MSF had an explanation for this absence:

“From the onset of the epidemic, the U.S. biotechnology company Metabiota and Tulane University, partners of Sierra Leone’s Kenema hospital, had the lead in supporting Sierra Leone’s Ministry of Health in investigating suspected cases. Their investigations came back Ebola negative, while their ongoing surveillance activities seem to have missed the cases of Ebola that had emerged in the country.”

MSF’s suggestion that the Kenema lab was missing Ebola cases accords with AP’s investigation in Sierra Leone.

AP reporters obtained an email sent by WHO Ebola coordinator Philippe Barboza on 8th Aug, 2014. It stated:

[Metabiota staffers]“are systematically obstructing any attempt to improve the existing surveillance system and there are a lot of improvement(s) needed”

Another WHO official, outbreak specialist Eric Bertherat, had already reached similar conclusions. In an email dated July 17th he told colleagues there was “no tracking of the samples” and “absolutely no control on what is being done“. The result was “total confusion“. Later, a paper about the outbreak authored by Bertherat, Barboza, and others, referred to “considerable unmonitored transmission in the early months of the epidemic” and the withholding of data from the authors by Metabiota (Senga et al., 2017).

And Sylvia Blyden, a senior advisor to the Sierra Leone Government, told AP that Metabiota

“messed up the whole region.”

When MSF did at last get permission to work in Sierra Leone, they were taken by surprise:

“When we set up operations in Kailahun [a town equidistant between Kenema and Guéckédou], we realised we were already too late. There were cases everywhere, and we built the centre with 60 beds, rather than the 20 we started with in Guinea,” said MSF’s Anja Wolz.

But, just like the WHO, MSF got no cooperation from Kenema:

“The Ministry of Health and the partners of Kenema hospital refused to share data or lists of contacts with us, so we were working in the dark while cases just kept coming in.”

MSF agreed with Sylvia Blyden that failure at Kenema had major repercussions:

“After a short period of raised hopes in May as cases appeared to be declining in Guinea and Liberia, the hidden outbreak in Sierra Leone mushroomed and reignited the outbreak for its neighbours.”

This sentence is the second reference in MSF’s report to the Sierra Leone outbreak being “hidden”. Apparently, MSF thought that the failure to report cases from Sierra Leone was not a simple bungle.

These independent investigations, and the MSF report in particular, raise fundamental questions: Did the outbreak really begin in Guinea? Or did it in fact start in Sierra Leone? Did early testing and diagnostic failings in Sierra Leone bring about a narrative that placed the origin across the border in Guinea? Given the intentionality imputed by many of these witnesses to the failings in Sierra Leone, were they deliberate? If so, were they intended to divert attention away from the Kenema lab?

Phylogenetic analysis of the Ebola 2014 outbreak contradicts the standard narrative

To this day, the bat-tree-boy narrative still stands as the leading explanation for the West African Ebola outbreak of 2014 (Holmes et al., 2016). Even though no additional evidence in its favour has emerged since (such as the discovery of a natural source of Ebola in West Africa, despite intensive searching of wildlife), only very rarely do researchers even note that the story of Emile is effectively “anecdotal” (Spengler et al., 2016).

The 2014 Ebola outbreak (which is now referred to as the Makona strain of Ebola) marked the full debut of mass viral genome sequencing during an outbreak. In all, about 5 percent of confirmed Ebola cases in West Africa were sequenced, with each sequence having sampling time and location data attached to it. The total data set contains about 1,500 Ebola genomes, including from some of the earliest known cases.

Phylogenetic analysis is a set of methods to organise and visualise this vast quantity of genetic information. It can give detailed insights into the timing and connection between cases and so phylogenies have the potential to resolve where and when the virus emerged (see e.g. Holmes et al., 2016). For example, phylogenetic analysis has been used to show instances of the disease crossing and re-crossing the borders between Guinea, Sierra Leone and Liberia, and in which direction (Dudas et al., 2017).

This genetic information is now publicly available. It can be conveniently accessed and visualised via the open-source virology website Nextstrain.org, which is the source of the phylogenies in the figures below.

Since the on-the-ground epidemiology is clearly uncertain, the chief scientific reason for not taking the possibility of a lab origin seriously has been that a large number of phylogenetic analyses have been performed and these have consistently stated that the origin was unambiguously in Guinea (Dudas and Rambaut, 2014; Baize et al., 2014; Gire et al., 2014; Carroll et al., 2015; Hoenen et al., 2015; Kugelman et al., 2015; Ladner et al., 2015; Park et al., 2015; Simon-Loriére et al., 2015; Quick et al., 2016; Tong et al., 2016; Arias et al., 2016; Holmes et al., 2016; Dudas et al., 2017).

At first glance it seems clear why this should be. Figure 4 is a screenshot of the whole 2014 Ebola outbreak. It is taken from Nextstrain’s interactive Ebola phylogeny page. (Note: For this screenshot, and all the figures below it, specific Nextstrain settings were selected to highlight sampling dates and their country of origin.)

Figure 4 is a screenshot taken from Nextstrain's interactive Ebola page. It is set to highlight countries of origin and, along the x-axis, the timeline of cases. The red arrow points to the putative origin.
Figure 4 A screenshot taken from Nextstrain’s interactive Ebola page. It is set to highlight countries of origin and, along the x-axis, the timeline of cases. The superimposed red arrow points to the putative origin.

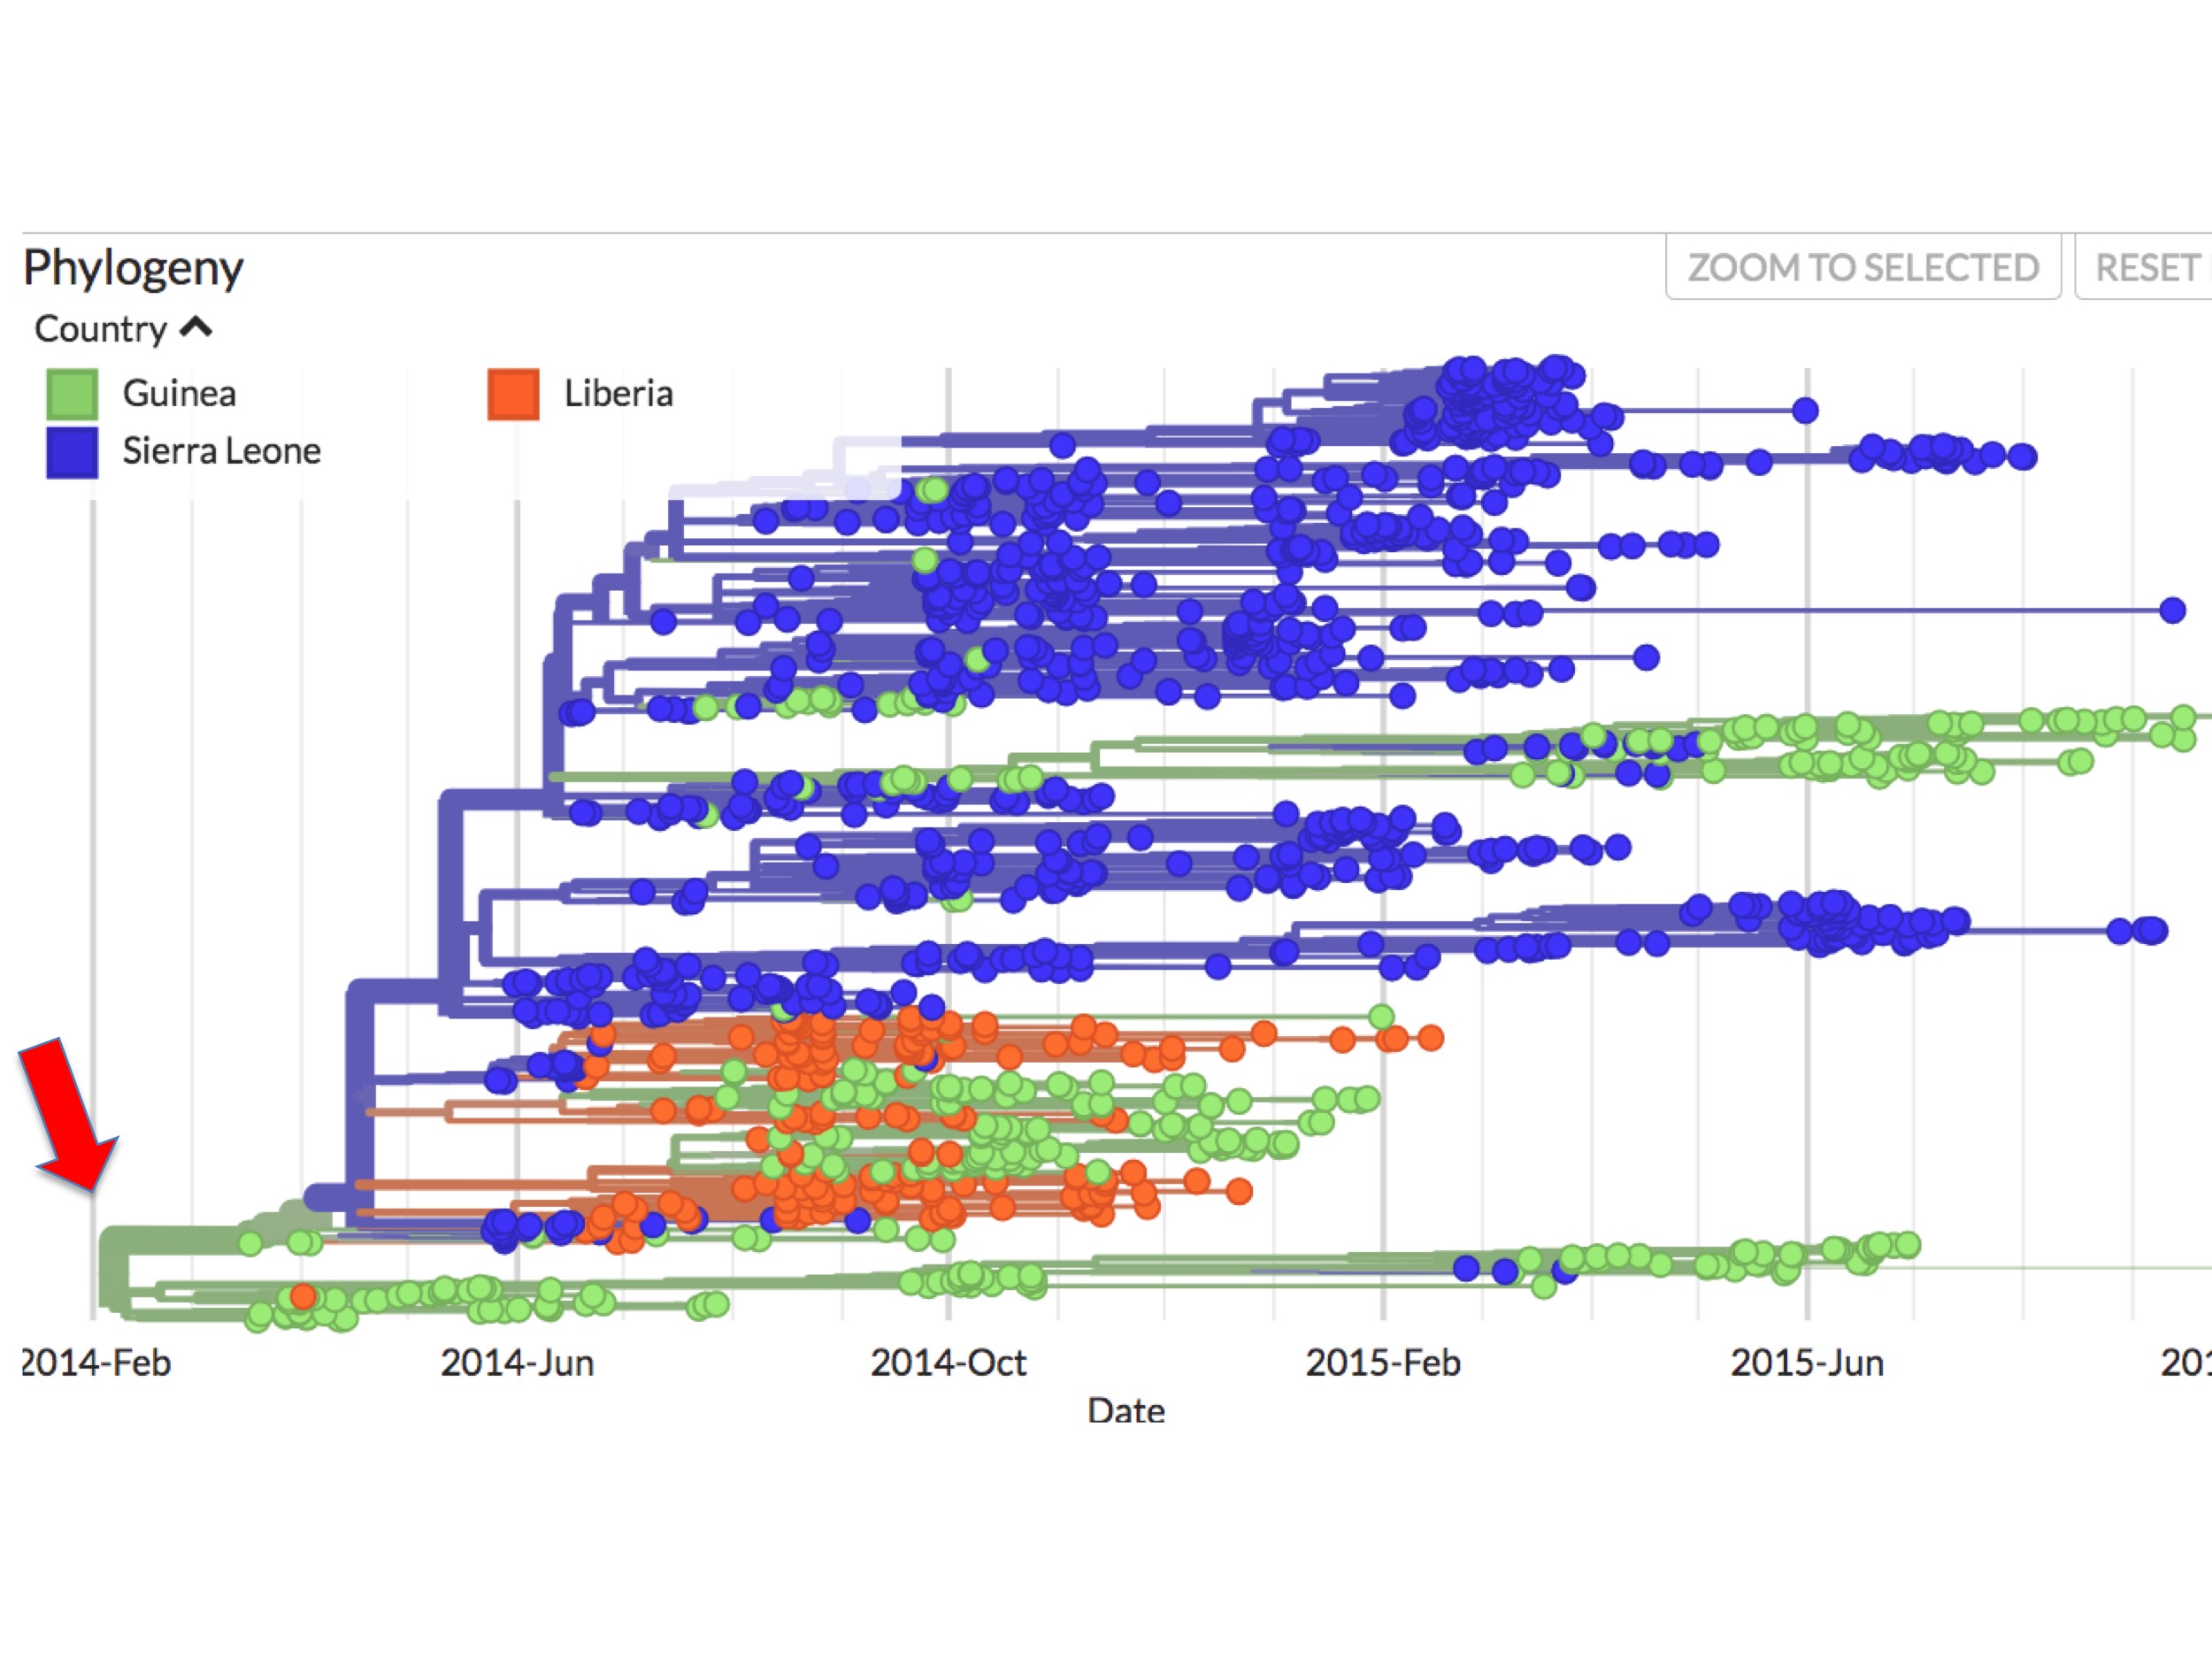
In Nextstrain (and thus figure 4 and succeeding figures), spots correspond to individual Ebola genomes sampled from single patients. Green spots are those diagnosed in Guinea; blue spots are patients diagnosed in Sierra Leone; and orange spots are cases from Liberia. The lines between them indicate inferred evolutionary connections between each sampled genome, resulting in a phylogenetic tree. The colours of these lines reflect an inference. They are Nextstrain’s calculation of the main country where the lineage is found.

In figure 4 it can be seen that all the early (prior to May 25th, 2014) sequences map to Guinea. Presenting the data this way implies that the root virus of the epidemic (red arrow at the left) jumped into humans in Guinea.

Though superficially simple, this interpretation gives rise to several anomalies, however.

Phylogenetic anomalies from assigning the root to Guinea

As figure 4 showed, beginning very early in the outbreak, the virus became separated into two major genetic lineages (i.e. branches).

This bifurcation can be better seen in figure 5. It is a screenshot of the same webpage but focusing only on the origin. It identifies two separate lineages called here SL-1 and GU-1.

Close-up of the origin from Nextstrain's Ebola page. The putative origin is indicated by the red arrow
Fig. 5 Close-up of the origin from Nextstrain’s Ebola page. The location of the putative origin is indicated by the red arrow.

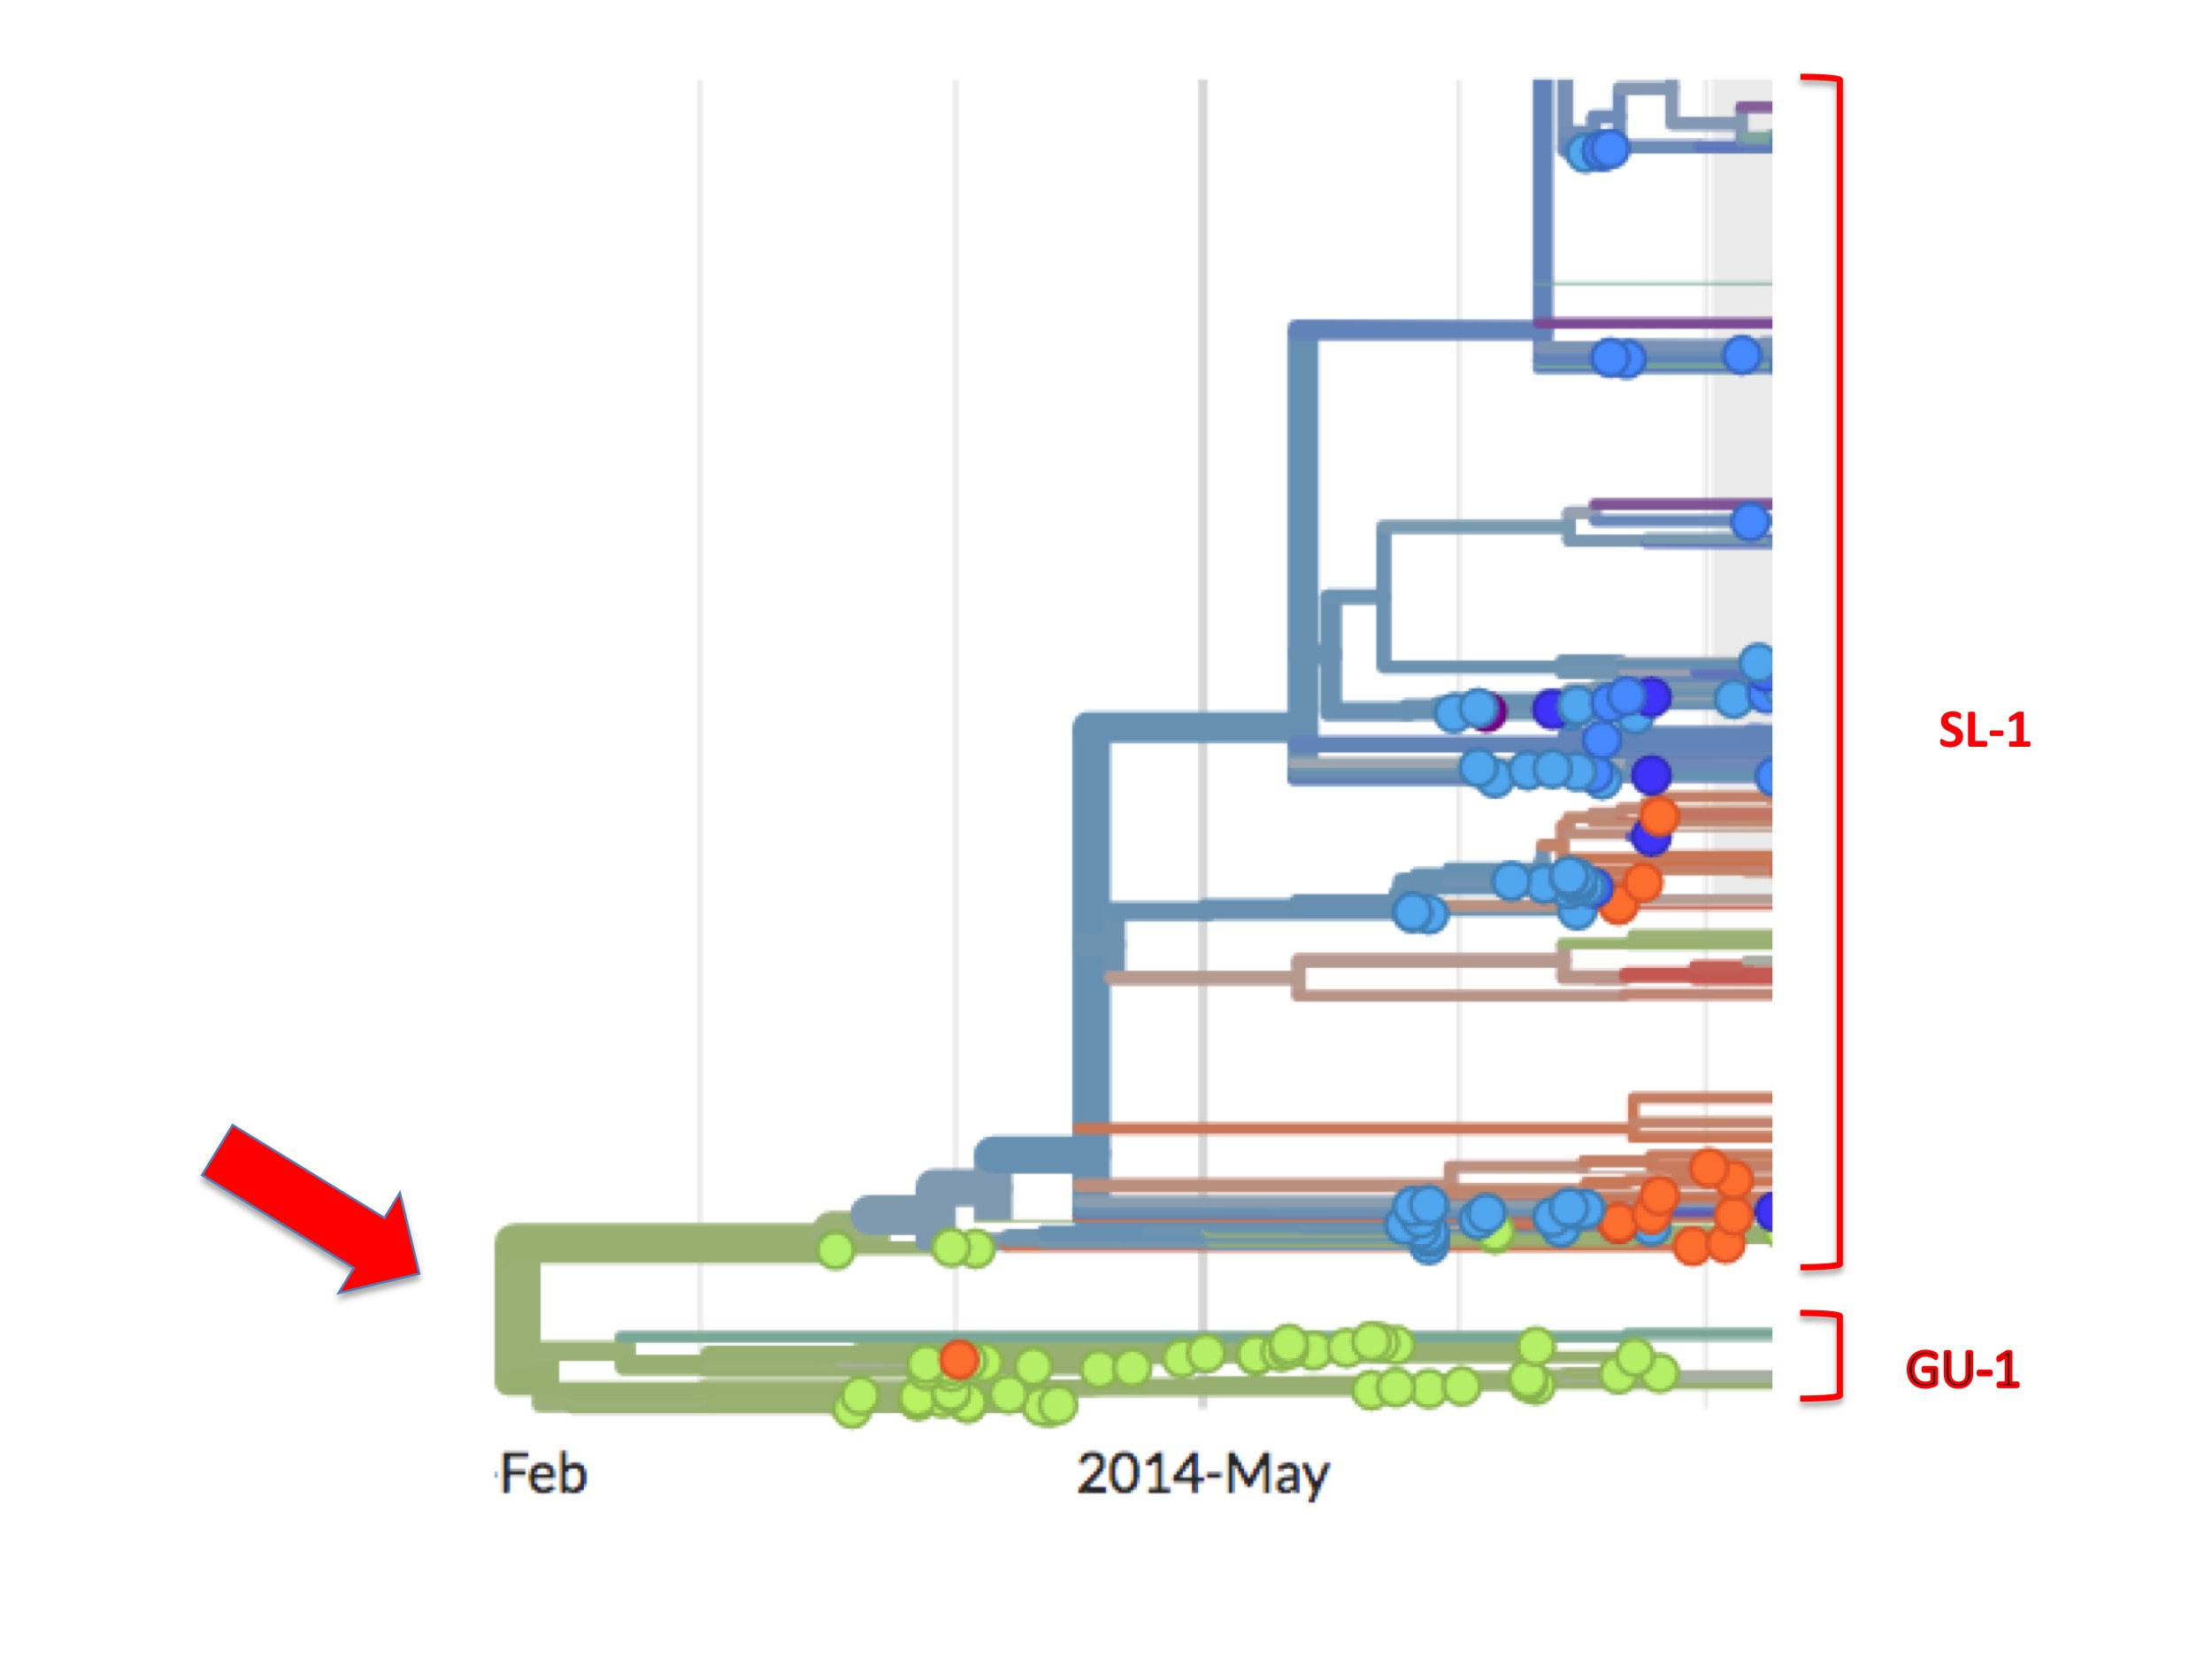
Of the two, the GU-1 lineage presents a straightforward case. This lineage arose in Guinea (the first examples are green spots) and most descendant viruses are also coloured green. That is to say, from its establishment to its extinction, the GU-1 lineage was almost entirely confined to Guinea. Of the few exceptions one is an orange (i.e. Liberian) spot in the GU-1 lineage. Presumably, one person infected with a GU-1 lineage virus travelled to Liberia where they were sampled and their genome was sequenced. There is also a small cluster of blue/purple spots dating from early 2015 (that are not visible in figure 5). A cluster implies, similarly, that one infected person took the GU-1 strain to Sierra Leone causing a small outbreak there and some of these descendants were diagnosed and sequenced.

A lineage beginning in Guinea and largely staying there is to be expected. Moreover, from Nextstrain one can see that the GU-1 lineage caused relatively few cases (compared to the SL-1 lineage). This concurs with the standard understanding that MSF brought the Guinea outbreak under control relatively quickly.

The upper lineage (SL-1) followed a very different pattern. First, it was not controlled and became responsible for the majority of cases in the entire West African outbreak. This lineage spread primarily in Sierra Leone but it also spread sporadically into Liberia (orange spots) and also into Guinea, as indicated by its green spots. SL-1 was thus responsible for most of the eventual 30,000 cases and most of the 11,000+ Ebola deaths.

However, the SL-1 lineage has a curious feature that is highlighted in figure 6.

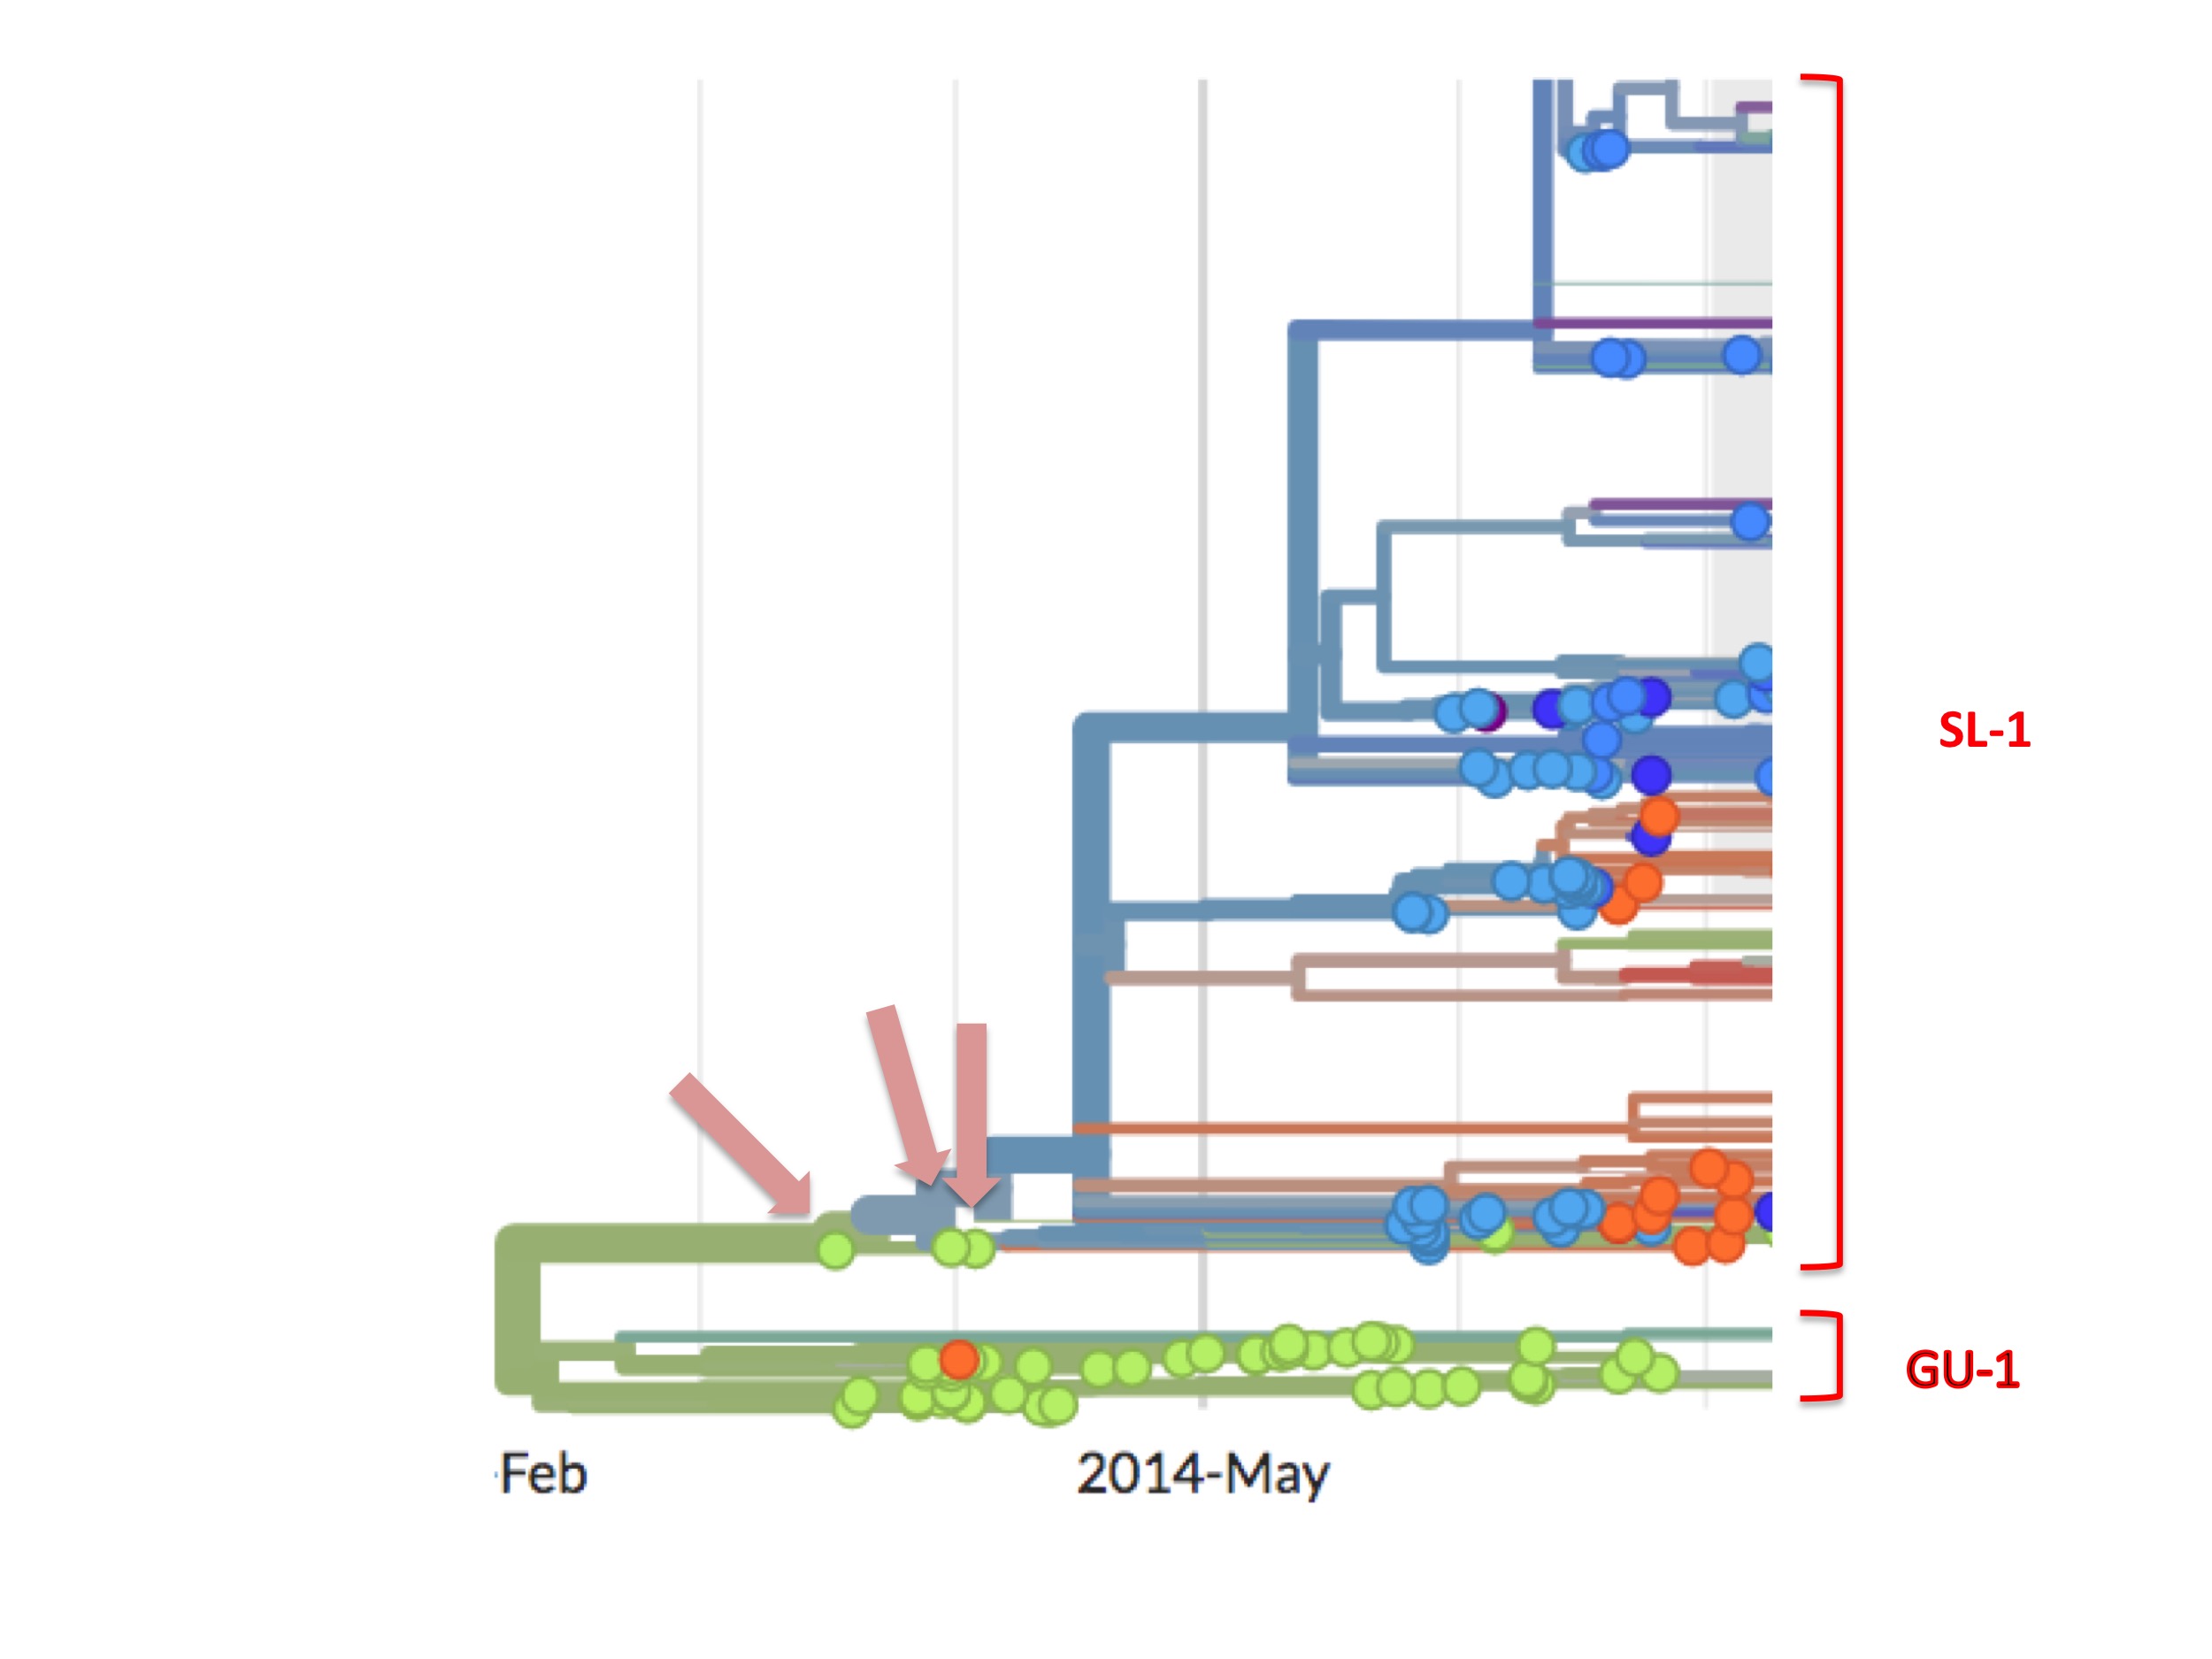
SL-1 begins with three green (Guinean) spots (Kissidougou C-15, EM_079410 and EM_079442), but their viral descendants are all blue spots, meaning that these descendants were all Ebola cases diagnosed in Sierra Leone.

Ebola 2014: The three pink arrows point to the three Guinea genome sequences at the base of the SL-1 lineage.
Fig. 6. Ebola 2014: The three pink arrows point to the three Guinea genome sequences at the base of the SL-1 lineage.

The orthodox interpretation of this has always been that the outbreak started in Guinea and spread into Sierra Leone.

However, looking carefully, this interpretation is difficult to sustain, for three reasons. First, from the data on the GU-1 lineage we know that a Guinean taking a GU-1 strain of the virus to another country was a rare event. It happened just twice in the 18 months of the outbreak there, once to Liberia and once to Sierra Leone. Dudas et al. asked this question in a different way and they concluded that, in the whole outbreak (which was doubtless much larger than the 30,000 recorded cases), only nine times did anyone with Ebola enter Sierra Leone from Guinea (Dudas et al. 2016). The orthodox interpretation nevertheless requires that, among the small handful of initial Guinean cases, one of them took the virus to Sierra Leone.

Second, the absence of green spots downstream of the first three indicates that these early Guinean cases failed to infect any further Guineans.

Thirdly, the disappearance of the SL-1 lineage in Guinea coincided in time with its appearance in Sierra Leone. Thus, the SL-1 lineage did not just spread into Sierra Leone, it also, simultaneously, vanished from Guinea

Each one of the three requirements of the orthodox view are, on their face, somewhat unlikely. Taken together, in science-speak, they represent a non-parsimonious explanation that suggests we might consider alternative ones.

(As an aside, close inspection of Nextstrain’s Ebola data shows there are occasional green (Guinean) spots in the SL-1 lineage and, later on, minor green outbreaks. One such virus is EM_79876, indicated by the black arrow in figure 7 below. In principle, any of these green spots in the SL-1 lineage might represent a continuation of a cryptic Guinean SL-1 outbreak. However, we can be fairly confident that EM_79876 [sampled June 5th, 2014], and others not shown, are instead independent later cross-border introductions from the outbreak in Sierra Leone. This confidence derives first from the long time intervals between identification of the first three green spots and the appearance of these latter samples [e.g. EM_79876 was sampled on June 5th, over two months after its last Guinean ancestor, which was sampled on April 3rd], and second because of the high genetic similarity of these downstream green samples to viruses identified in Sierra Leone. This interpretation is confirmed by Nextstrain. This link is to a screenshot showing in close-up how Nextstrain interprets the provenance of the earliest of these green spots in the SL-1 lineage [EM_79876 and EM_79880, both sampled June 5th 2014, and some others]. By showing these green spots as descending from one or more blue lines, Nextstrain’s algorithm is agreeing with our interpretation: that such green spots are all descendants of viruses found in Sierra Leone, thus they are introductions from there and not indicative of cryptic spread in Guinea).

The black arrow points at a green spot early in the SL-1 lineage
Figure 7. The black arrow points at a green spot early in the SL-1 lineage.

Thus, to recap, the phylogenetic tree of the full epidemic indicates that the SL-1 lineage did not merely spread from Guinea into Sierra Leone but moved wholesale into it. What that means in practice is that all early patients in Guinea carrying viruses from the SL-1 lineage infected only individuals from Sierra Leone and no one from Guinea, their supposed home country.

Such anomalies should raise eyebrows of an even minimally curious researcher. Why should a root virus first identified in Guinea fail to initiate an outbreak in Guinea? Why should cases in Guinea start an epidemic in Sierra Leone? And why also should the disappearance of the SL-1 lineage from Guinea coincide in time with its appearance in Sierra Leone?

Resolving the rooting conundrum

There is a potential simple resolution to this conundrum. Let us hypothesise that the three green samples at the root of the SL1 outbreak were mislabelled or misallocated, and thereby wrongly assigned to Guinea instead of Sierra Leone.

If one re-labels each of them blue (i.e. Sierra Leonean) then the early stages of the pandemic phylogenetic tree resolve into two branches with no wholesale leap of one lineage into Sierra Leone. There was an origin, which, sometime before sampling started, split into two branches. One branch (GU-1) spread in Guinea and was largely contained; the other (SL-1) spread in Sierra Leone and was not controlled.

This hypothesis simplifies the scenario greatly, but is there a good reason for suggesting such misattributions? There is.

According to the contact tracing described in MSF’s report, some early cases in Guinea had no connections there but instead appeared to come from Sierra Leone (which is only 12 miles from Guéckédou). If true, though diagnosed in Guinea and therefore attributed to Guinea (and given green spots by Nextstrain), such patients are better understood as part of a Sierra Leone outbreak.

The hypothesis is thus that the three early green cases at the root of the SL-1 lineage are not properly from Guinea but instead represent spillovers from an undetected outbreak in Sierra Leone. These cases were thus labelled green only because they were picked up in Guinea, where sampling and contact tracing were effective.

Adjusting the tree accordingly provides a solution that accords with the evidence and is parsimonious since it resolves what is an otherwise highly perplexing state of affairs. However, there is one difficulty.

For any cases to have spilled from Sierra Leone in March, 2014, there must have been Ebola in Sierra Leone. Yet, officially, the first case was not diagnosed there until May 25th, 2014 (Goba et al., 2016). However, as the next section will show, there is strong phylogenetic evidence for such an outbreak.

Before discussing that evidence, it is imperative to note that assigning these three cases to Sierra Leone has important consequences for locating the origin of the outbreak. The sampling date of one of them (Kissidougou-C15) is March 17th. It is the earliest Ebola Makona genome ever sampled and the other two are also among the very earliest cases known. So, just as researchers have used these three samples to deduce that the origin was in Guinea, relabelling them shifts the presumed origin to Sierra Leone.

The MSF report provides additional clues as to which of the two countries was the true source of the epidemic. Drawing on distinct strands of evidence, MSF suggested that it was Sierra Leone since: (1) contact tracing showed that some very early cases came from Sierra Leone; (2) the outbreak in Guinea was mysteriously dispersed (and note also that Baize et al.’s early cases, though located in Guinea, were all at different points along the border with Sierra Leone); (3) when MSF set up in Kailahun (in Sierra Leone) the outbreak was already much worse in Kailahun than was the outbreak in Guinea; (4) the MSF report also suggested an outbreak in Sierra Leone was ‘hidden’ by poor or absent diagnostic procedures. The email from WHO’s Phillippe Barboza corroborates this by separately alleging that, in Kenema, Metabiota was “systematically obstructing” surveillance. A lack of surveillance and sequencing in Sierra Leone is important. It would suffice to explain why, if there was an outbreak in Sierra Leone that occasionally was spreading into Guinea, no Sierra Leone samples (blue dots) occur at the base of the SL-1 lineage.

The following section therefore addresses this key question: was there an early outbreak in Sierra Leone?

Further evidence of a hidden outbreak in Sierra Leone

Inspection of the genome sequences at the base of the SL-1 branch reveals another anomaly.

The first Ebola genome sequence officially from Sierra Leone is an accession called EM_095. It was obtained from a patient on May 25th, 2014. This date is over two months after the first confirmed Guinean cases were sampled. The next day (May 26th) two more patient samples were taken in Sierra Leone and later sequenced, these are Ebola accessions G_3677 and EM_096. The genome of G_3677 differs from EM_095 by four mutations, while EM_096 differs from EM_095 by seven mutations. Just one day later, on May 27th, Ebola accession G_3670 was obtained from another patient. It differs from EM0_95 by six mutations. The following day (May 28th), G_3679 was obtained. It also differs from EM_095 by six mutations. However, these six mutations are not the same six mutations as those by which G_3670 differs from EM_095. What this genome sequencing indicates is that substantial genetic diversity in the Ebola virus population already existed in Sierra Leone by the time the medics there first started testing.

This diversity has a simple meaning. It was not generated in four days; rather, it shows that mutations had been building up in an unsampled viral population. Thus a viral outbreak in Sierra Leone had existed for some considerable time before May 25th.

Subsequent sequencing efforts in Sierra Leone, which were much more comprehensive, uncovered yet more evidence of early diversity, thus confirming and extending this finding.

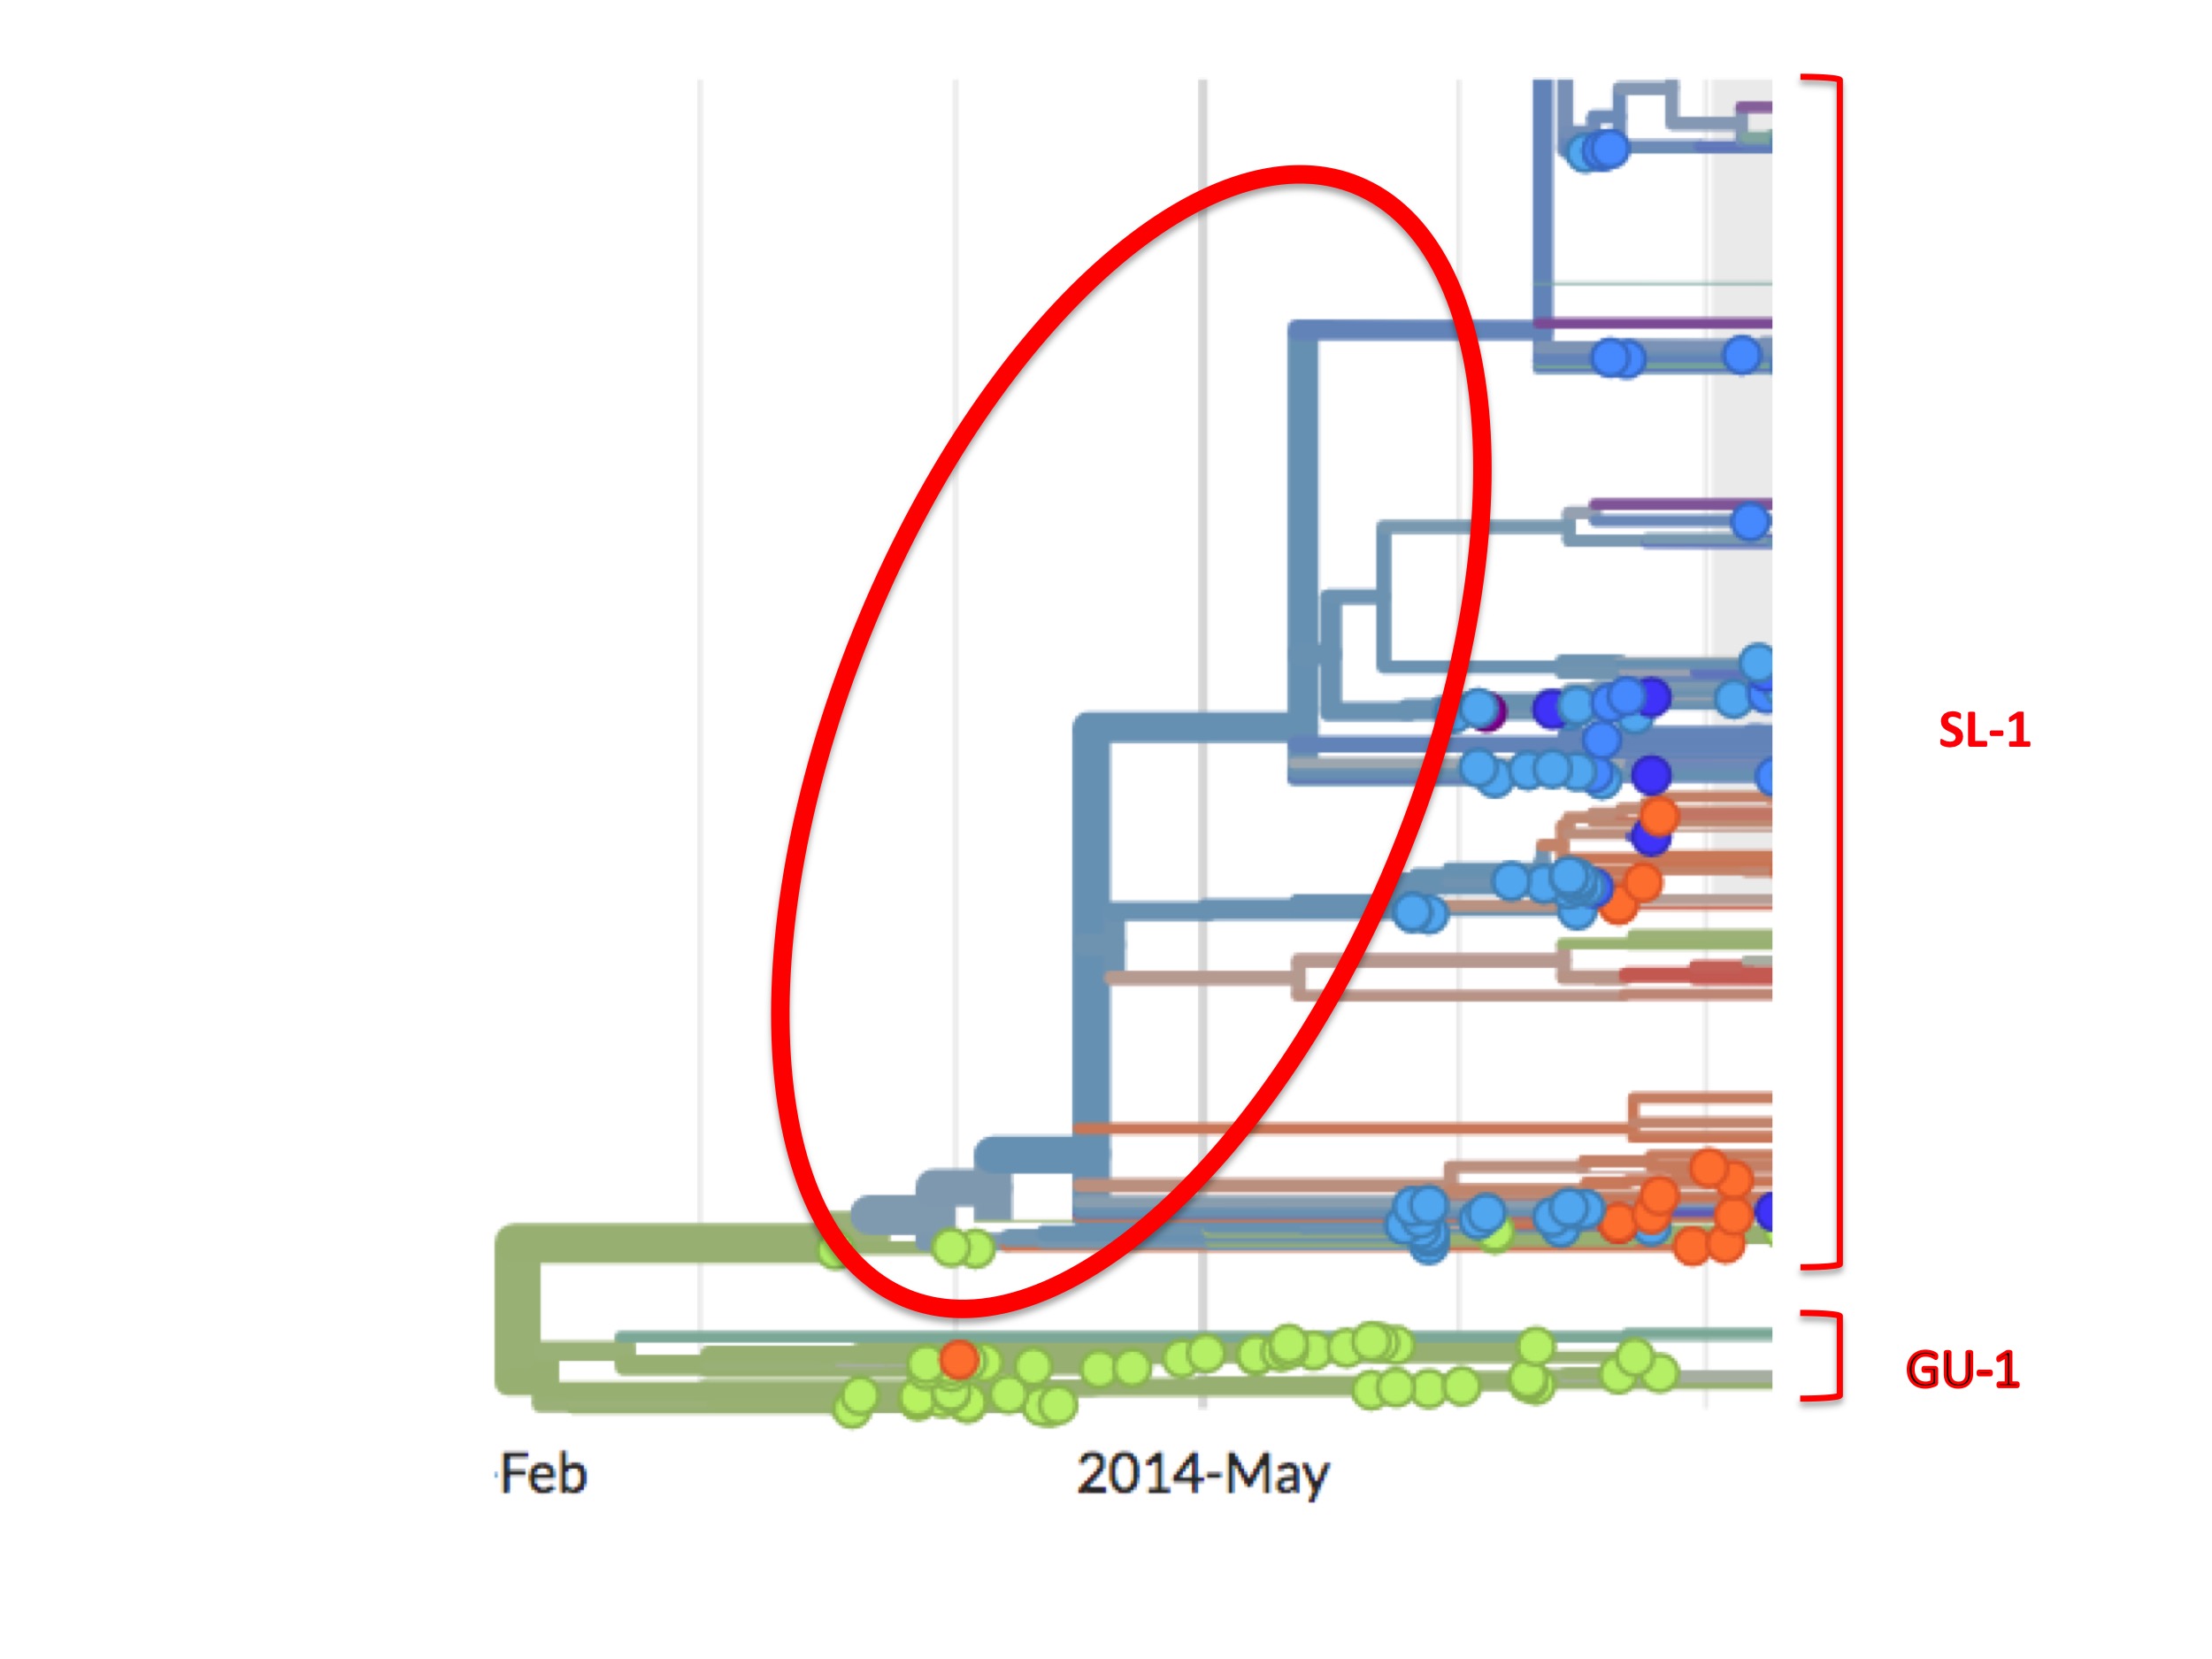
This high viral diversity existing prior to May 25th is apparent from the Nextstrain phylogenetic tree (see figure 8, below). It shows up as a set of bifurcating blue lines prior to May 25th. A bifurcating tree without spots (i.e. samples), as highlighted in figure 8 by the red oval, represents Nextstrain’s prediction of viral intermediates early in the growth of the SL-1 lineage, even though these were never sampled.

Fig. 8 Unsampled bifurcations early in the phylogeny of lineage SL-1.
Fig. 8 Unsampled bifurcations early in the SL-1 lineage.

It is important to note that this diversity in the SL-1 lineage prior to late May was probably not from any outbreak in neighbouring Guinea at the time. This is because (as the figures also show) in Guinea there was abundant testing and sequencing (many green spots) prior to May 25th. If these or other virus strains had existed in Guinea they would likely have been picked up by the contact tracing and other efforts there, measures we know were comprehensive enough at that time to suppress the Guinea outbreak.

As noted above, the scientific literature contains dozens of papers detailing the events of the Ebola Makona outbreak. Of those published in high-profile journals, or in any of the fourteen papers presenting a phylogenetic analysis of the outbreak, there is no mention of these anomalies. However, three rarely-cited papers in low-profile journals (one is even in a “Supplement”) do acknowledge deficits in early sampling, contact tracing, and case ascertainment efforts in Sierra Leone, i.e. at the base of the SL-1 lineage (Wauquier et al., 2015; Goba et al., 2016; Senga et al., 2017).

Though in low-ranking journals, these last three papers are key data points since they represent researchers and epidemiologists in Sierra Leone corroborating MSF’s assessment of a missing or “hidden” outbreak in Sierra Leone.

The phylogeny: a summary

From the above it seems clear that the orthodox account of a Guinean origin for the Ebola 2014 epidemic is inconsistent on several counts with the accepted phylogenetic tree. One major anomaly is the unexplained early migration of the SL-1 lineage from Guinea into Sierra Leone. The second is the sudden and unexplained appearance in late May and early June 2014 of diverse Ebola strains in Sierra Leone that imply the existence of a substantial undetected outbreak there. However, these two anomalies are consistent with each other and with our proposed resolution, which is that the earliest confirmed case (Kissidougou C–15) and two others diagnosed in Guinea represent spillovers from Sierra Leone and not an origin in Guinea.

Furthermore, from MSF’s report and the WHO emails uncovered by AP, the epidemic is more likely to have begun in Sierra Leone and only later spread into Guinea.

This assemblage of evidence is interesting on several counts. Not only does it derive from diverse sources–phylogenetics, epidemiology, email correspondences–it also creates a coherent alternative account that fits all the data currently available. Taken together, the obvious inference is that the 2014 Ebola outbreak began in Sierra Leone and not Guinea.

A Sierra Leone origin is not per se a lab origin, however.

What is the origin of the Makona strain?

A major question nevertheless remains before considering the possibility of a lab origin–What is the source of the Makona strain?

The Makona strain of Ebola is not a standard or known strain, nor is it similar to any published strain. It is novel, having approximately 400 mutations that are not found in any previously known Ebola strain (Gire et al., 2014).

Hence, for the 2014 Ebola outbreak to have begun in a lab, the Makona strain must either represent the escape of an unpublished strain, perhaps one collected during fieldwork in central Africa. Alternatively, Makona could be a radically manipulated derivative of a known strain–either through genetic engineering or passaging. A combination of these two possibilities should also be considered.

Of these two alternatives, we know that Ebola and other viruses were being sought from wild animals in the Congo basin at the time as part of USAID’s PREDICT project. The chief actors in this were the Wildlife Conservation Society (WCS) and Metabiota, which, at the time, was at the time a partner of the VHFC.

Researchers from these two organisations searched the Congo basin and collected large numbers of blood samples, faecal samples and other genetic material from likely wild animal sources of Ebola: bats, animals captured for bushmeat, and apes (Olson et al., 2012; Reed et al., 2014; Seimon et al., 2015; Kumakamba et al., 2021). Other samples were obtained from human patients from the Congo (Grard et al., 2012). Some of this prospecting activity overlaps in time with the outbreak in West Africa.

Thus, one possibility is that Metabiota, or other collectors, used the VHFC lab at Kenema as part of a cold chain for the preservation of samples brought from the Congo basin. This might have been necessary since the Congo basin has historically been a politically unstable region and less friendly to US interests. The Kenema lab may also have been used for initial screening or testing of such samples. A third possibility is the formal or informal sharing of samples or strains with VHFC contacts or colleagues at Kenema, perhaps to help in the development of commercial treatments or diagnostic tools.

The kinds of samples that could have carried Ebola from the Congo basin include wildlife blood and tissue samples, samples from humans with suspected illnesses, and even whole animals or patients themselves. The possibility that the Kenema site was used for screening or testing of samples collected in other countries is especially intriguing in light of the statement that Matt Boisen made to Reuters: “we do have the ability to do a lot more in the same amount of time.”

Given these potentialities it is remarkable to discover that, in July 2014, during the epidemic, the VHFC wrote a brief report in which they accused Metabiota of an activity that would be riskier still. The VHFC accused Metabiota staff at Kenema of culturing cells from Ebola patients, which they insisted was dangerous and should “be stopped immediately.”

Metabiota issued a qualified denial, but the allegation is highly credible since the two organisations shared the same site; moreover its implications are very great. It suggests, first, that Metabiota had an interest in culturing novel strains of Ebola, second, that they had the technical capability and the personnel competent to do so at Kenema, and third, that they were willing to take exceptional risks. As the VHFC states, culturing Ebola in a small, uncertified, and unsecure lab would be very dangerous–culturing viruses is normally considered the most problematic biosafety step in virus research since it is an amplification process. The allegation therefore raises, in a very concrete way, the question of what Metabiota might have been doing in Kenema prior to the outbreak.

We know too, from the history of lab acquired infections of Ebola and Ebola-like viruses, that spillovers to humans do not require cultivation of the virus and can result from research accidents with live or deceased animals, with isolated tissues, or through the manipulation of patient samples (Luby et al., 1969; Emond et al., 1977; Formenty et al., 1999 ; Anonymous, 2004). Also important to note is that, in some of these cases, Ebola was not known to be present in the sample when the accident occurred.

Thus, given the research interests and the capacities of the VHFC lab in Kenema and its collaborators, it is a relatively simple matter to theorise how a novel strain of Ebola, like Makona, might have reached Kenema and then spilled over there during routine research activities.

Interesting too is the dual role of Metabiota. Besides collecting samples from the wild, Metabiota was also the company that, at least according to MSF and the WHO, obstructed or mishandled testing and diagnosis at Kenema and that Sylvia Blyden alleged “messed up the whole region.” If a research error on the part of Metabiota was the source of the strain (and Metabiota’s incompetence has been widely alleged), or even suspected to be, they would have had a strong incentive to also ‘bungle’ the identification of early cases and so obfuscate the origin.

Funding Cutoffs

It is also possible that the government of Sierra Leone suspected that Ebola came from the Kenema lab.

On July 23, 2014, in the midst of the Ebola outbreak, its Ministry of Health and Sanitation used its Facebook page (now deleted) to set out a series of orders. These were widely reported in the Sierra Leone media and were to “be effectual immediately”.

One injunction was for “Tulane University” (Robert Garry’s home institution) and the treatment center at Kenema to cease admitting new patients. “Tulane” was also instructed to leave the Kenema lab. Part four instructed the Kenema lab “to stop Ebola testing during the current Ebola outbreak.”

This last instruction is especially intriguing. Literally, it implies the lab was conducting research on the virus. However, the wording is ambiguous; quite possibly, given the circumstances, the lab was only being instructed to cease testing for Ebola. Either way, amidst a catastrophic epidemic it is a seemingly counterproductive but striking step to publicly close down a major international testing and treatment site.

Furthermore, just two weeks later, on Aug. 7, 2014, again in the midst of the outbreak, the U.S. government announced a similar decision. It cut funding to Tulane and the VHFC.

As related by Reuters: “The National Institutes of Health rejected a proposal from New Orleans-based Tulane University to renew the five-year contract which expires in November, according to a July 30 letter from NIH reviewed by Reuters. The expiring contract is worth $15 million.”

“NIH declined to comment on the decision,” citing “federal government procurement integrity rules.” 

The Consortium was nevertheless able to secure other sources of funding. At the end of 2014, Corgenix received an infusion of over $800,000 from the Bill & Melinda Gates Foundation and the Paul G. Allen Family Foundation that it split with its partners.

On October 17, 2014, President Barack Obama named Ron Klain “Ebola czar”. Klain is now chief of staff in the Biden administration. The same day, the Obama White House instituted a “pause on funding for any new studies that include certain gain-of-function experiments involving influenza, SARS, and MERS viruses.”

The official statement connected the decision to recent biosafety incidents at Federal research facilities which had received a measure of media coverage. The New York Times reported on the move, noting that the pause: “made no mention of Ebola or any related filovirus.”

However, the timing of the announcement is suggestive that the research pause and the Ebola outbreak were connected.

Did researchers fix the phylogenetic analysis to cover up the origin of the 2014 Ebola outbreak?

Because so many Ebola genomes were sequenced during the 2014-2016 Ebola outbreak, a succession of major scientific papers appeared that analysed the epidemic in great detail from a phylogenetic perspective (Dudas and Rambaut, 2014; Baize et al., 2014; Gire et al., 2014; Carroll et al., 2015; Hoenen et al., 2015; Ladner et al., 2015; Park et al., 2015; Simon-Loriére et al., 2015; Quick et al., 2016; Tong et al., 2016; Arias et al., 2016; Holmes et al., 2016; Dudas et al., 2017). Many of these paid especial attention to the beginning of outbreak and to establishing the identity of the root virus and its geographic location.

All of them placed the outbreak origin unambiguously in Guinea. None of them seems to have considered how placing the root there generates the questions and anomalies discussed above.

A partial explanation for this conviction that the epidemic began in Guinea is that, in an outbreak situation, there are two standard methods to establish the identity of a root virus (Lyons-Weiler et al., 1998). Both methods begin by constructing an unrooted phylogenetic tree (which simply demonstrates the relatedness of all the viruses in the data set without assigning a root virus). To choose a root virus, one employs a genetic out-group in the form of one (or more than one) slightly more distantly related genome(s) on the theory that the root virus in an outbreak will be the one most closely related to the out-group(s). Most phylogenetic trees are generated with this method. The second method uses the timing of samples to infer the root virus. The reasoning is that the root virus will be (or be closely related to) the earliest viruses sampled (Drummond et al., 2006).

The latter method, since it relies on sample dating, has a major potential flaw: a susceptibility to sampling biases. Supposing the epidemic started in Sierra Leone but samples were taken there only long after sampling had begun in Guinea. In that case, a method reliant on sample timing would wrongly place the root virus in Guinea. This flaw is well known to phylogenetic experts (Liu et al., 2020; Kumar et al., 2021). As Kumar et al. stated it:

“Some methods also incorporate sampling times in phylogenetic inference, but they will automatically favor placing the earliest sampled genomes at or near the root of the tree. This fact introduces circularity in testing the hypothesis that the earliest sampled genomes were ancestral because sampling time is used in the inference procedure.”

To anyone knowing (or suspecting) that sampling preferentially began in one location only, in this case because MSF was initially invited only to Guinea or because Metabiota and Tulane bungled their response (as was widely alleged), then relying on sample dating to infer the root of the 2014 outbreak amounts to circular reasoning.

Every one of the 13 phylogeny papers listed above, however, used sample dating to locate the root virus. Only four of them also used an out-group method. Of these four, three did not explicitly test (or state) whether out-group rooting confirmed the dating result (Gire et al., 2014; Dudas and Rambaut, 2014; Holmes et al., 2016). For the fourth, this test was premature since only three genome sequences (all from Guinea) were available then (Baize et al., 2014).

In other words, even though many of these papers were published in the foremost scientific journals, like Science (Gire et al., 2014; Hoenen et al., 2015), Nature (Carroll et al., 2015; Simon-Loriére et al., 2015; Quick et al., 2016; Tong et al., 2016; Holmes et al., 2016; Dudas et al., 2017) and Cell (Park et al., 2015), their conclusions, that the epidemic began in Guinea are unsound due to this circularity and failure to make use of an out-group.

The circularity of relying on timing alone was surely known to the senior authors (and presumably to peer-reviewers also). Many of these authors must also have been aware of MSF’s report and the AP investigation. Why then was the obvious step of testing the Guinea root with an out-group skipped in all these papers? Was it because doing so would contradict a Guinean origin?

We are not in a position to remedy that omission. However, what we can say is that not corroborating the clearly flawed clock method with the obvious test is a very puzzling and troubling omission–all the more so since placing the origin in Guinea generates clear genetic and epidemiological anomalies.

Our conclusion, just from the phylogeny of the outbreak alone, is that, much like the epidemiological studies on Emile and Meliandou, the certainty with which researchers have placed the origin in Guinea is unwarranted. Much more likely, the true site of emergence was in Sierra Leone.

A close-knit band of conflicted researchers

The totality of the phylogenetic evidence, supporting Sierra Leone as the source, must be considered alongside all the other evidence relevant to the origin. As noted above, despite much searching, there is so far no evidence for an animal reservoir for Zaire Ebola in West Africa (Goldstein et al., 2018). The Makona strain’s sudden appearance in the region was thus unexpected and is still unexplained. Furthermore, the epidemiological investigations in Guinea and Sierra Leone were inconclusive and unconvincing. There was, however, a single spillover event, which is also consistent with a lab origin. And last, there was a research laboratory nearby that specialised in viral haemorrhagic fevers. The VHFC lab may or may not have housed Ebola viruses but it certainly had a dubious biosafety record.

All of the evidence, including the phylogeny, is therefore consistent with a lab origin. It is hence exceedingly difficult to understand why the 2014 West African Ebola outbreak has repeatedly been cited as a clear-cut example of a zoonotic outbreak.

Hence, like Chernoh Bah before us, the unacknowledged extreme contrast between the standard account and the evidence base compelled us to consider whether there was not, at some level, a concerted scientific effort to deflect attention from the VHFC and its lab in Kenema.

Some observations about the authors of these phylogenetic papers on the origin of the 2014 Ebola outbreak (and the epidemiological ones too) seem pertinent.

The first point is the pattern of substantial overlapping authorship amongst the papers that studied the epidemic and especially among the phylogenetic analyses that placed the origin in Guinea. Some of these overlaps are highlighted in Table 1.

Table 1: Overlapping authorships in epidemiological and phylogenetic publications about the 2014 Ebola outbreak

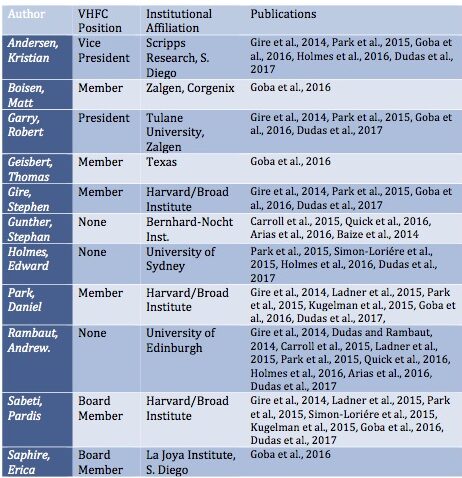
One or more of just six researchers are represented on all of them: Robert Garry, Andrew Rambaut, Stephan Gunther, Kristian Andersen, Pardis Sabeti, and Edward Holmes are lead authors on almost all of these publications. Of the two exceptions, one addresses only the Mali outbreak (Hoenen et al., 2015). The second is from China’s CDC (Tong et al., 2015). (However, a senior author of this paper is George Gao, China’s CDC recently departed head and a long-time associate of Rambaut and Holmes).

Second, many of the authors are now very prominent figures in the scientific disciplines of evolutionary virology and epidemiology (Andrew Rambaut, Robert Garry, George Gao, Edward Holmes, Gytis Dudas, Kristian Andersen, Wu-Chun Cao, Andreas Gnirke, Patrick Drury, Pierre Formenty, Trevor Bedford, Jonathan Towner, Gustavo Palacios, Stuart Nichol). One of them is celebrated geneticist Eric Lander, who, until he was forced to resign in February, 2022, was President Biden’s chief science advisor and is the founding director of the prestigious Broad Institute, whose Sabeti lab is a partner of the VHFC. (Gire et al., 2014).

Third, most of the senior authors of the phylogeny papers (notably, Robert Garry, Kristian Andersen, Pardis Sabeti, Erica Ollman Saphire, Daniel Park, and Stephen Gire) and plenty of less well-known authors, are directly connected to the VHFC and its Kenema lab. These authors in particular, have a career-sized conflict of interest, which they may also think is dwarfed by the possibility of being implicated in 11,000 deaths.

Lastly, in the face of widespread suspicions of a lab origin for SARS-CoV-2, many of these same authors (Robert Garry, Andrew Rambaut, Kristian Andersen, Edward Holmes, and Stuart Nichol) have become perhaps the most prominent and ardent defenders of a zoonotic origin for COVID-19.

How this overlap came about would seem a key question for both the Ebola and SARS-CoV-2 outbreaks.

As was learned from Freedom of Information Act requests, early in the COVID-19 pandemic, Anthony Fauci, head of the NIAID, secretly enlisted a small group of virologists to confer with (see p3134 of these emails) about whether SARS-CoV-2 originated from a lab. As evidence pointing to a lab origin for COVID-19 accumulated, this group evolved into what we have called Anthony Fauci’s COVID origin SWAT team. Not only were its members principals in arguing against lab origin theories, they even adopted many of the same scientific and phylogenetic misdirection strategies and tactics as those described above to suppress COVID-19 lab origin speculation.

Fauci’s initial discussion group included Drs Garry, Rambaut, Andersen, and Holmes, but what expertise did they bring to the table? Rambaut and Holmes had contributed to a handful of publications on the evolution of coronaviruses. On the other hand, Garry and Andersen, according to the standard database, Google Scholar, had never authored a single paper on coronaviruses before joining the group. Is it possible, therefore, that when COVID-19 broke out in Wuhan, the consideration uppermost in the mind of Anthony Fauci when he chose his secret circle was not scientific expertise but instead to find researchers familiar with the scientific and political challenges posed by a potential lab outbreak?

This link between Ebola 2014 and COVID-19 raises a closing question: to what extent is the COVID-19 outbreak, with its likely lab origin, a repeat event? Is COVID-19 the price to be paid for not conducting open, thorough, and forensic investigations of virus outbreaks, and instead leaving those tasks to the mercy of the researchers with the most vested interests?

Furthermore, it is difficult not to notice that the funding regime for pathogen research has spectacularly rewarded the researchers most involved in the Ebola 2014 outbreak. Though the VHFC and/or its then partner Metabiota are strong candidates to have initiated the whole event, and although they are also widely believed to have “messed up the whole region” by botching the initial response, the VHFC has profited greatly from the catastrophe. Not only did its personnel get to publish numerous papers in prestigious journals and so considerably enhance their careers, the VHFC now has a clinic three times the size of the old one. In 2016, the US Navy built a brand new clinic at Kenema with state of the art research, biosafety, water supply, and decontamination systems, including an entirely new building to serve as a ‘biorepository’ (Goba et al., 2016).

Such perverse rewards are forms of injustice. Like all injustice, they flourish in the dark. To serve justice, as well as to help prevent future outbreaks, the people of West Africa deserve to have the most intense light possible shed on the question of why Ebola came to them in 2014.

Sam Husseini is an independent journalist. Jonathan Latham, PhD, is a virologist.

References
Andersen, K. G., Rambaut, A., Lipkin, W. I., Holmes, E. C., & Garry, R. F. (2020). The proximal origin of SARS-CoV-2Nature medicine26(4), 450-452.
Arias, A., Watson, S. J., Asogun, D., Tobin, E. A., Lu, J., Phan, M. V., … & Cotten, M. (2016). Rapid outbreak sequencing of Ebola virus in Sierra Leone identifies transmission chains linked to sporadic casesVirus evolution2(1).
Baize, S., Pannetier, D., Oestereich, L., Rieger, T., Koivogui, L., Magassouba, N. F., … & Günther, S. (2014). Emergence of Zaire Ebola virus disease in GuineaNew England Journal of Medicine371(15), 1418-1425.
Barnes, K. G., Lachenauer, A. E., Nitido, A., Siddiqui, S., Gross, R., Beitzel, B., … & Sabeti, P. C. (2020). Deployable CRISPR-Cas13a diagnostic tools to detect and report Ebola and Lassa virus cases in real-timeNature communications11(1), 1-10.
Bornholdt, Z. A., Noda, T., Abelson, D. M., Halfmann, P., Wood, M. R., Kawaoka, Y., & Saphire, E. O. (2013). Structural rearrangement of ebola virus VP40 begets multiple functions in the virus life cycleCell154(4), 763-774.
Carroll, M. W., Matthews, D. A., Hiscox, J. A., Elmore, M. J., Pollakis, G., Rambaut, A., … & Günther, S. (2015). Temporal and spatial analysis of the 2014–2015 Ebola virus outbreak in West Africa. Nature524(7563), 97-101.
Dudas, G., & Rambaut, A. (2014). Phylogenetic analysis of Guinea 2014 EBOV Ebolavirus outbreakPLoS currents6.
Dudas, G., Carvalho, L. M., Bedford, T., Tatem, A. J., Baele, G., Faria, N. R., … & Rambaut, A. (2017). Virus genomes reveal factors that spread and sustained the Ebola epidemicNature544(7650), 309-315.
Drummond, A. J., Ho, S. Y. W., Phillips, M. J., & Rambaut, A. (2006). Relaxed phylogenetics and dating with confidencePLoS biology4(5), e88.
Dunning, J., Sahr, F., Rojek, A., Gannon, F., Carson, G., Idriss, B., … & RAPIDE-TKM trial team. (2016). Experimental treatment of Ebola virus disease with TKM-130803: a single-arm phase 2 clinical trialPLoS medicine13(4), e1001997.
Emond, R. T., Evans, B., Bowen, E. T., & Lloyd, G. (1977). A case of Ebola virus infectionBr Med J2(6086), 541-544.
Feldmann, H., & Geisbert, T. W. (2011). Ebola haemorrhagic feverThe Lancet377(9768), 849-862.
Forbes, K. M., Webala, P. W., Jääskeläinen, A. J., Abdurahman, S., Ogola, J., Masika, M. M., … & Sironen, T. (2019). Bombali virus in Mops condylurus bat, KenyaEmerging Infectious Diseases25(5), 955.Gire, S. K., Stremlau, M., Andersen, K. G., Schaffner, S. F., Bjornson, Z., Rubins, K., … & Sabeti, P. C. (2012). Emerging disease or diagnosis?science338(6108), 750-752.
Formenty, P., Hatz, C., Le Guenno, B., Stoll, A., Rogenmoser, P., & Widmer, A. (1999). Human infection due to Ebola virus, subtype Cote d’Ivoire: clinical and biologic presentationThe Journal of infectious diseases179(Supplement_1), S48-S53.
Geisbert, T. W., Lee, A. C., Robbins, M., Geisbert, J. B., Honko, A. N., Sood, V., … & MacLachlan, I. (2010). Postexposure protection of non-human primates against a lethal Ebola virus challenge with RNA interference: a proof-of-concept studyThe Lancet375(9729), 1896-1905.
Gire, S. K., Goba, A., Andersen, K. G., Sealfon, R. S., Park, D. J., Kanneh, L., … & Sabeti, P. C. (2014). Genomic surveillance elucidates Ebola virus origin and transmission during the 2014 outbreakscience345(6202), 1369-1372.
Goba, A. et al., (2016) An Outbreak of Ebola Virus Disease in the Lassa Fever Zone. The Journal of Infectious Diseases. Supplement 3 S110.
Goldstein, T., Anthony, S. J., Gbakima, A., Bird, B. H., Bangura, J., Tremeau-Bravard, A., … & Mazet, J. A. (2018). Discovery of a new ebolavirus (Bombali virus) in molossid bats in Sierra LeoneNature microbiology3(10), 1084.
Grard, G., Fair, J. N., Lee, D., Slikas, E., Steffen, I., Muyembe, J. J., … & Leroy, E. M. (2012). A novel rhabdovirus associated with acute hemorrhagic fever in central Africa. PLos Pathogens e1002924.
Guha, S., Melnik, L., Garry, R. F., & Wimley, W. C. (2018). Ebola Virus Delta-Peptide Acts as an Enterotoxic Viroporin In VivoBiophysical Journal114(3), 265a.
Gunn, B. M., Yu, W. H., Karim, M. M., Brannan, J. M., Herbert, A. S., Wec, A. Z., … & Alter, G. (2018). A role for Fc function in therapeutic monoclonal antibody-mediated protection against Ebola virusCell host & microbe24(2), 221-233.
Hoenen, T., Safronetz, D., Groseth, A., Wollenberg, K. R., Koita, O. A., Diarra, B., … & Sow, S. (2015). Mutation rate and genotype variation of Ebola virus from Mali case sequencesScience348(6230), 117-119.
Holmes, E. C., Dudas, G., Rambaut, A., & Andersen, K. G. (2016). The evolution of Ebola virus: Insights from the 2013–2016 epidemicNature538(7624), 193-200.
Koehler, J. W., Smith, J. M., Ripoll, D. R., Spik, K. W., Taylor, S. L., Badger, C. V., … & Schmaljohn, C. S. (2013). A fusion-inhibiting peptide against Rift Valley fever virus inhibits multiple, diverse viruses. PLoS neglected tropical diseases7(9), e2430.
Kugelman, J. R., Wiley, M. R., Mate, S., Ladner, J. T., Beitzel, B., Fakoli, L., … & National Institutes of Health. (2015). Monitoring of Ebola virus Makona evolution through establishment of advanced genomic capability in LiberiaEmerging infectious diseases21(7), 1135.
Kumakamba, C., Niama, F. R., Muyembe, F., Mombouli, J. V., Kingebeni, P. M., Nina, R. A., … & Lange, C. E. (2021). Coronavirus surveillance in wildlife from two Congo basin countries detects RNA of multiple species circulating in bats and rodentsPloS one16(6), e0236971.
Kumar, S., Tao, Q., Weaver, S., Sanderford, M., Caraballo-Ortiz, M. A., Sharma, S., … & Miura, S. (2021). An evolutionary portrait of the progenitor SARS-CoV-2 and its dominant offshoots in COVID-19 pandemicMolecular Biology and Evolution38(8), 3046-3059.
Ladner, J. T., Wiley, M. R., Mate, S., Dudas, G., Prieto, K., Lovett, S., … & Palacios, G. (2015). Evolution and spread of Ebola virus in Liberia, 2014–2015Cell host & microbe18(6), 659-669.
Lee, J. E., Fusco, M. L., Hessell, A. J., Oswald, W. B., Burton, D. R., & Saphire, E. O. (2008). Structure of the Ebola virus glycoprotein bound to an antibody from a human survivorNature454(7201), 177-182.
Leendertz, S. A. J., Gogarten, J. F., Düx, A., Calvignac-Spencer, S., & Leendertz, F. H. (2016). Assessing the evidence supporting fruit bats as the primary reservoirs for Ebola virusesEcoHealth13(1), 18-25.
Leroy, E. M., Rouquet, P., Formenty, P., Souquiere, S., Kilbourne, A., Froment, J. M., … & Rollin, P. E. (2004). Multiple Ebola virus transmission events and rapid decline of central African wildlifeScience303(5656), 387-390.
Leroy, E. M., Kumulungui, B., Pourrut, X., Rouquet, P., Hassanin, A., Yaba, P., … & Swanepoel, R. (2005). Fruit bats as reservoirs of Ebola virusNature438(7068), 575-576.
Leroy, E. M., Epelboin, A., Mondonge, V., Pourrut, X., Gonzalez, J. P., Muyembe-Tamfum, J. J., & Formenty, P. (2009). Human Ebola outbreak resulting from direct exposure to fruit bats in Luebo, Democratic Republic of Congo, 2007Vector-borne and zoonotic diseases9(6), 723-728.
Luby, J. P., and Sanders, C. V. (1969). Green monkey disease (” Marburg virus” disease): a new zoonosisAnnals of internal medicine71(3), 657-660.
Luebo, Democratic Republic of Congo, 2007. Vector-borne and zoonotic diseases9(6), 723-728.
Liu, Q., Zhao, S., Shi, C. M., Song, S., Zhu, S., Su, Y., … & Chen, H. (2020). Population genetics of SARS-CoV-2: disentangling effects of sampling bias and infection clusters. Genomics, proteomics & bioinformatics18(6), 640-647.
Lyons-Weiler, J., Hoelzer, G. A., & Tausch, R. J. (1998). Optimal outgroup analysisBiological Journal of the Linnean Society64(4), 493-511.Murin, C. D., Fusco, M. L., Bornholdt, Z. A., Qiu, X., Olinger, G. G., Zeitlin, L., … & Saphire, E. O. (2014). Structures of protective antibodies reveal sites of vulnerability on Ebola virusProceedings of the National Academy of Sciences111(48), 17182-17187.
Nakajima, K., Desselberger, U., & Palese, P. (1978). Recent human influenza A (H1N1) viruses are closely related genetically to strains isolated in 1950Nature274(5669), 334-339.
Olson, S. H., Cameron, K., Reed, P., Ondzie, A., & Joly, D. (2012). Maximizing nonhuman primate fecal sampling in the Republic of Congo. Journal of Wildlife Diseases48(4), 888-898.
Park, D. J., Dudas, G., Wohl, S., Goba, A., Whitmer, S. L., Andersen, K. G., … & Sabeti, P. C. (2015). Ebola virus epidemiology, transmission, and evolution during seven months in Sierra Leone. Cell161(7), 1516-1526.
Pigott, D. M., Golding, N., Mylne, A., Huang, Z., Henry, A. J., Weiss, D. J., … & Hay, S. I. (2014). Mapping the zoonotic niche of Ebola virus disease in AfricaElife3, e04395.
Quick, J., Loman, N. J., Duraffour, S., Simpson, J. T., Severi, E., Cowley, L., … & Carroll, M. W. (2016). Real-time, portable genome sequencing for Ebola surveillance. Nature530(7589), 228-232.
Reed, P. E., Mulangu, S., Cameron, K. N., Ondzie, A. U., Joly, D., Bermejo, M., … & Sullivan, N. J. (2014). A new approach for monitoring ebolavirus in wild great apesPLoS Neglected Tropical Diseases8(9), e3143.
Saéz, A., Weiss, S., Nowak, K., Lapeyre, V., Zimmermann, F., Düx, A., … & Leendertz, F. H. (2015). Investigating the zoonotic origin of the West African Ebola epidemicEMBO molecular medicine7(1), 17-23.
Seimon, T. A., Olson, S. H., Lee, K. J., Rosen, G., Ondzie, A., Cameron, K., … & Lipkin, W. I. (2015). Adenovirus and herpesvirus diversity in free-ranging great apes in the Sangha region of the Republic of CongoPLoS One10(3), e0118543.
Senga, M., Koi, A., Moses, L., Wauquier, N., Barboza, P., Fernandez-Garcia, M. D., … & Lane, C. (2017). Contact tracing performance during the Ebola virus disease outbreak in Kenema district, Sierra LeonePhilosophical Transactions of the Royal Society B: Biological Sciences372(1721), 20160300.
Simon-Loriere, E., Faye, O., Faye, O., Koivogui, L., Magassouba, N., Keita, S., … & Sall, A. A. (2015). Distinct lineages of Ebola virus in Guinea during the 2014 West African epidemic. Nature524(7563), 102-104.
Spengler, J. R., Ervin, E. D., Towner, J. S., Rollin, P. E., & Nichol, S. T. (2016). Perspectives on West Africa Ebola virus disease outbreak, 2013–2016Emerging infectious diseases22(6), 956.
Tong, Y. G., Shi, W. F., Liu, D., Qian, J., Liang, L., Bo, X. C., … & Cao, W. C. (2015). Genetic diversity and evolutionary dynamics of Ebola virus in Sierra LeoneNature524(7563), 93-96.
Walsh, P. D., Abernethy, K. A., Bermejo, M., Beyers, R., De Wachter, P., Akou, M. E., … & Wilkie, D. S. (2003). Catastrophic ape decline in western equatorial AfricaNature422(6932), 611-614.
Wauquier, N., Bangura, J., Moses, L., Khan, S. H., Coomber, M., Lungay, V., … & Gonzalez, J. P. (2015). Understanding the emergence of Ebola virus disease in Sierra Leone: stalking the virus in the threatening wake of emergencePLoS Currents7.
Wilkinson, A. (2017). Emerging disease or emerging diagnosis? Lassa Fever and Ebola in Sierra LeoneAnthropological Quarterly, 369-397.
Worobey, M., Levy, J. I., Serrano, L. M. M., Crits-Christoph, A., Pekar, J. E., Goldstein, S. A., … & Andersen, K. G. (2022). The Huanan market was the epicenter of SARS-CoV-2 emergence.
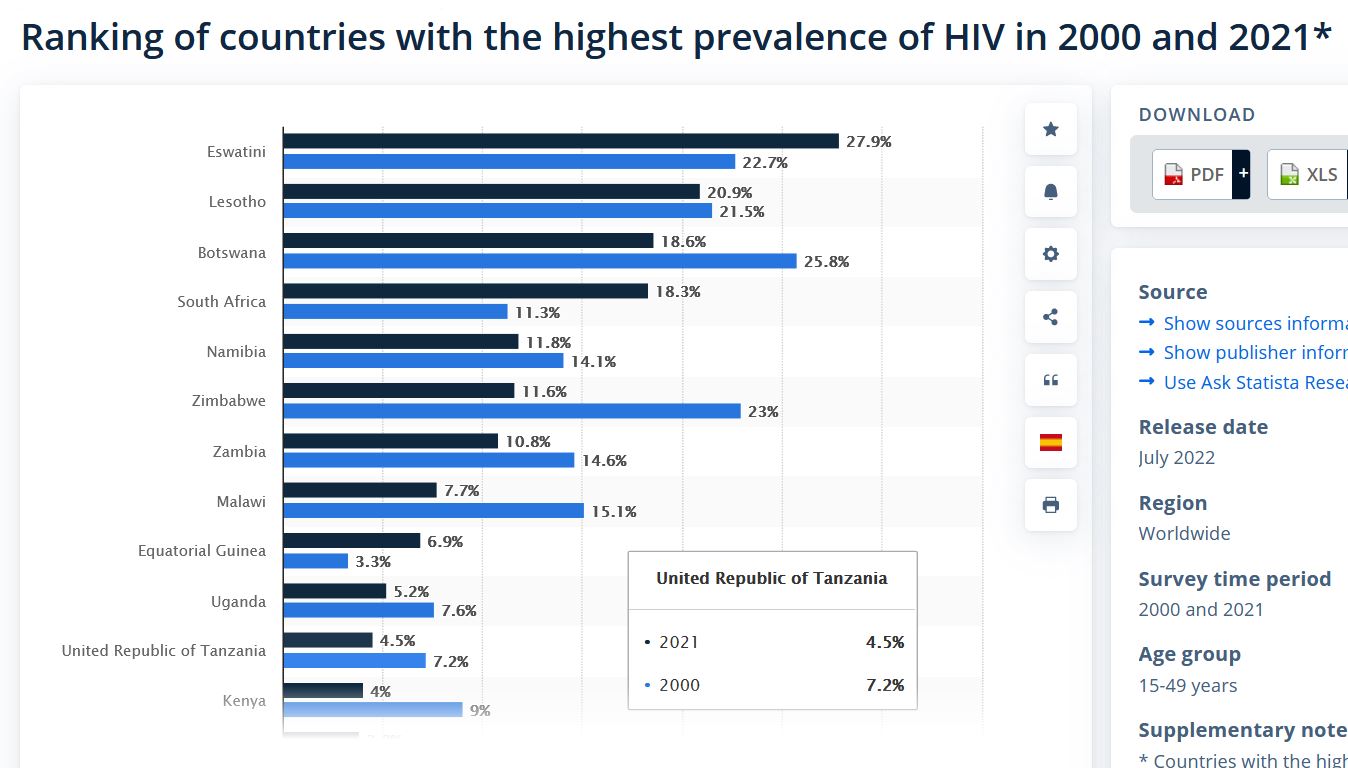
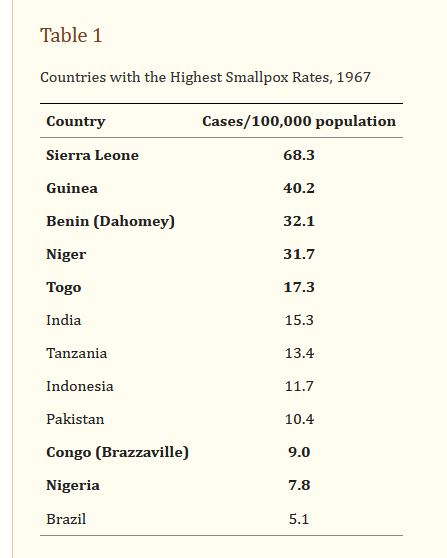
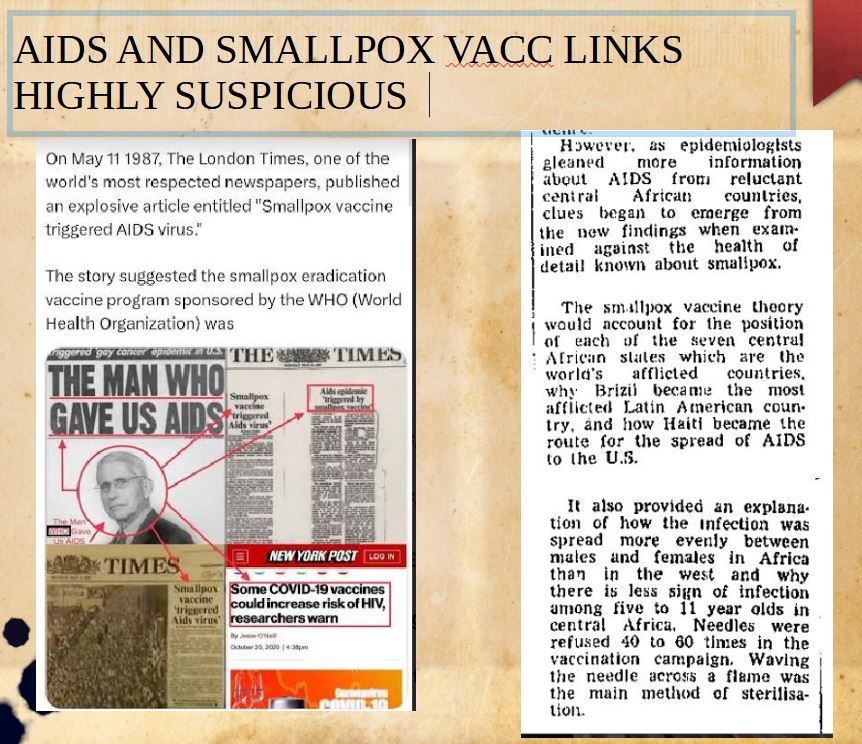
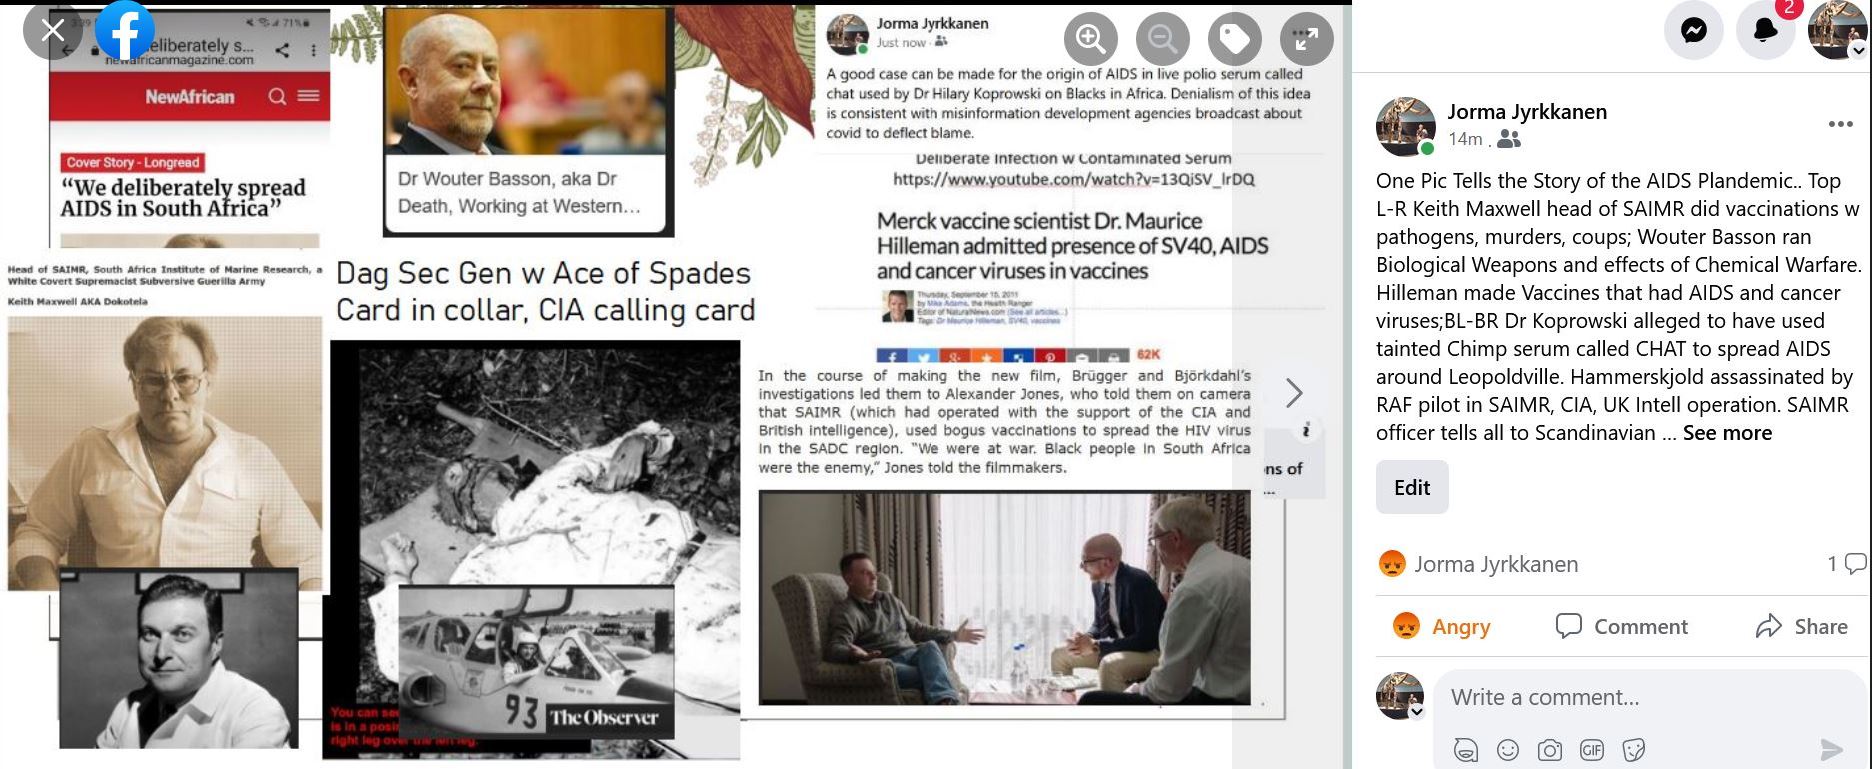
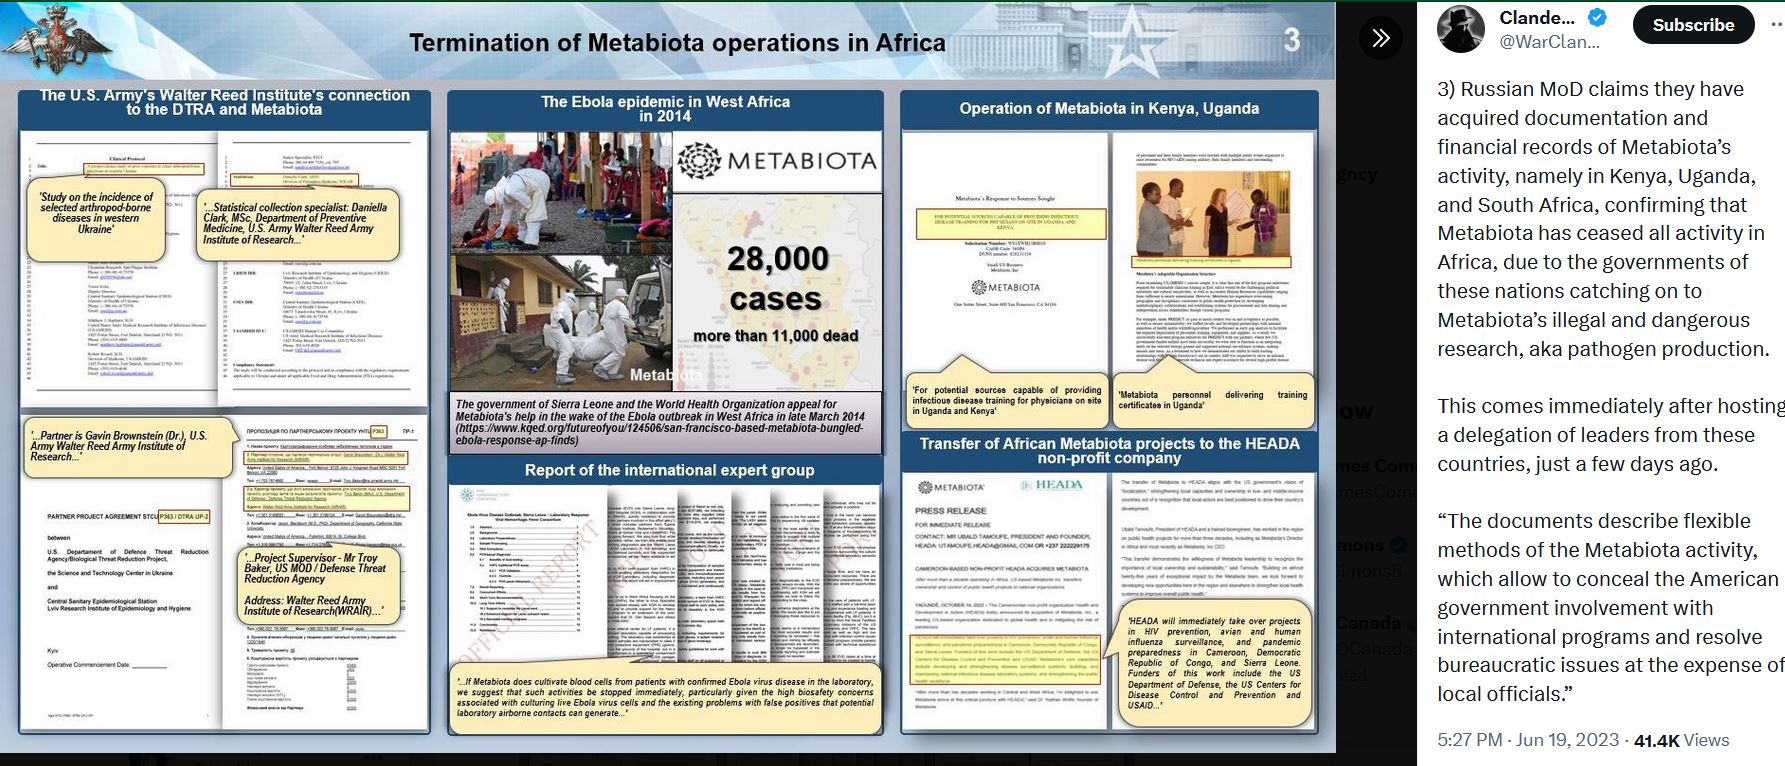
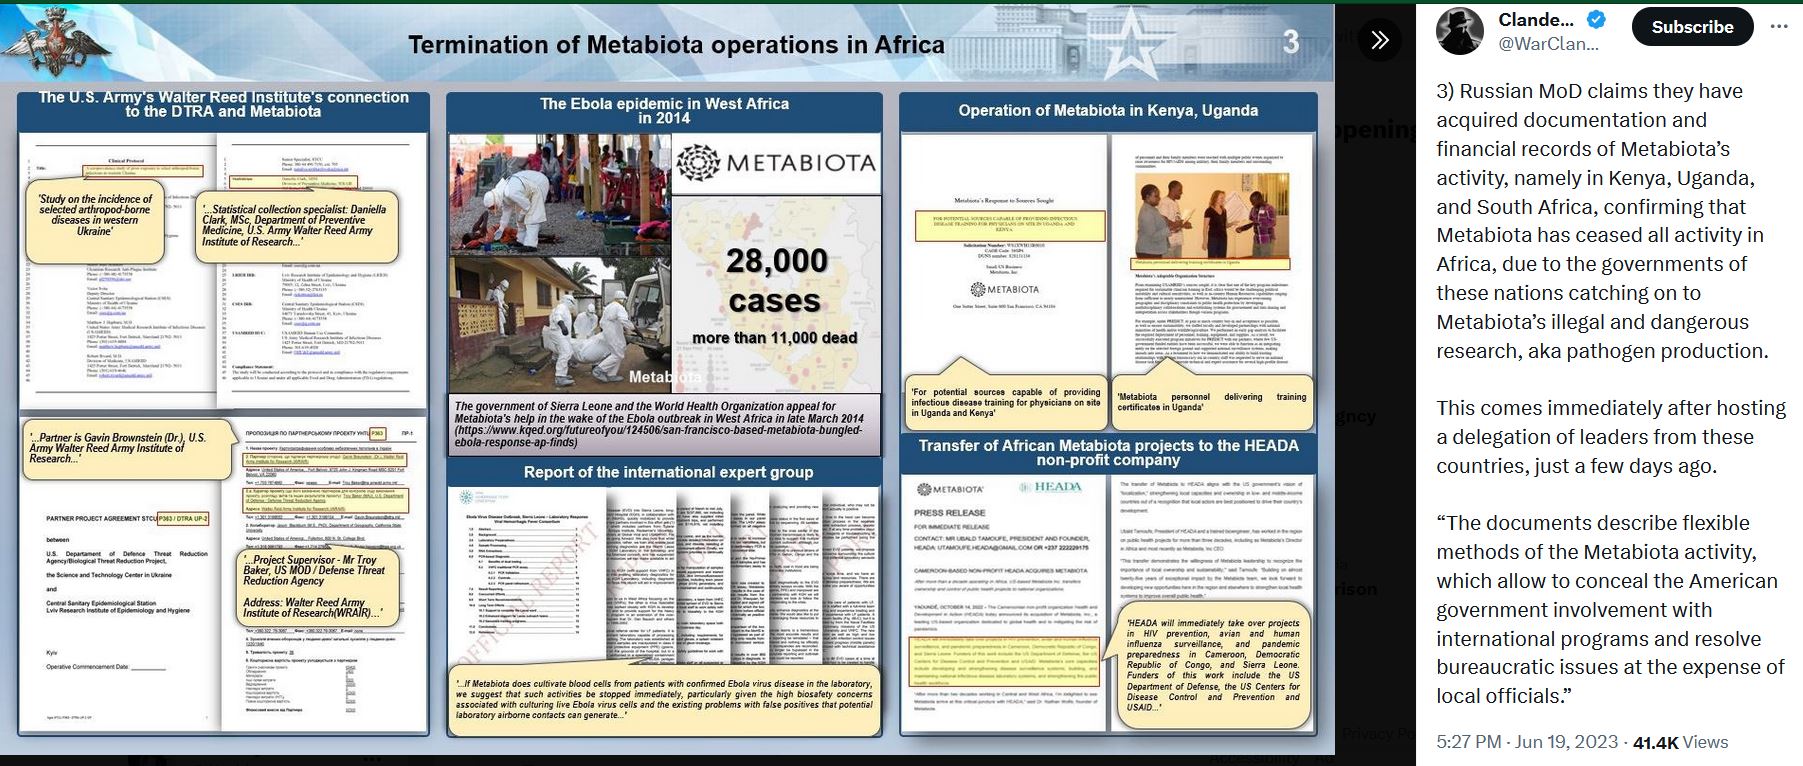
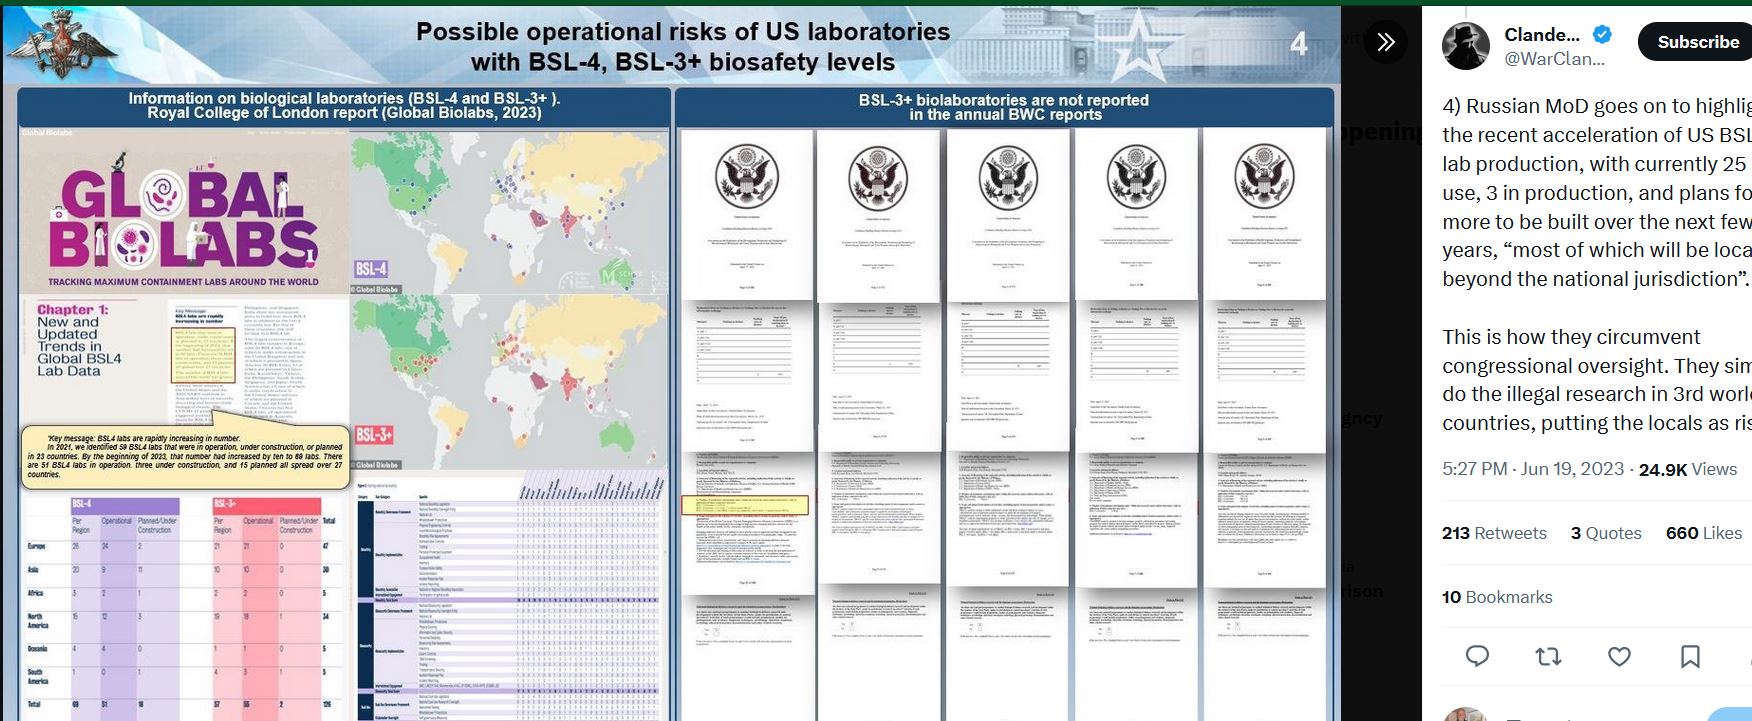
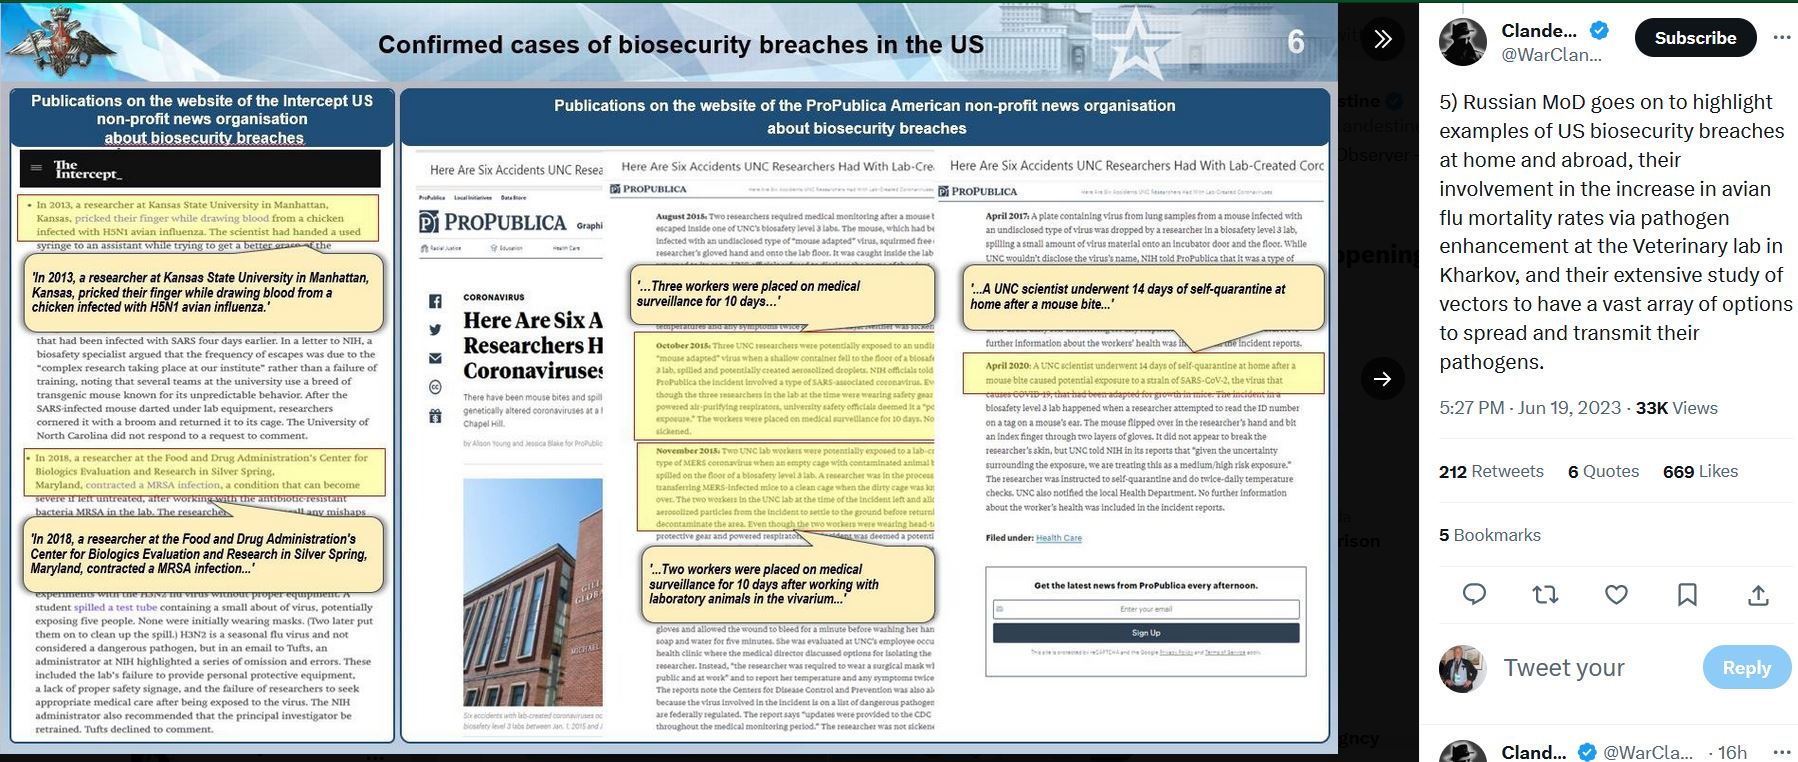
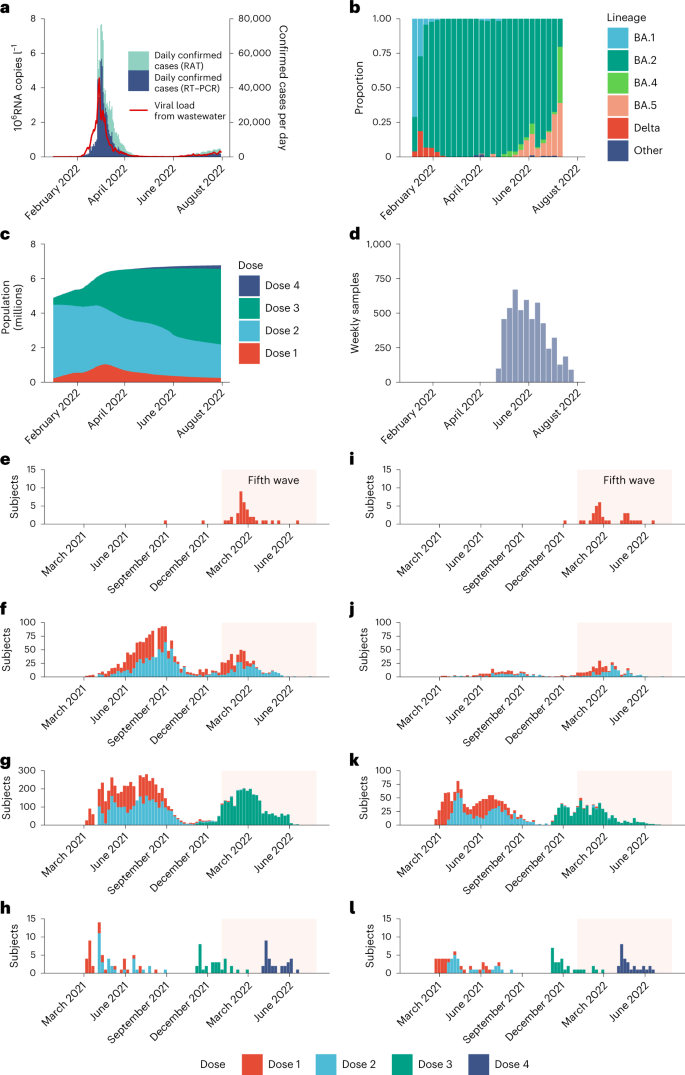
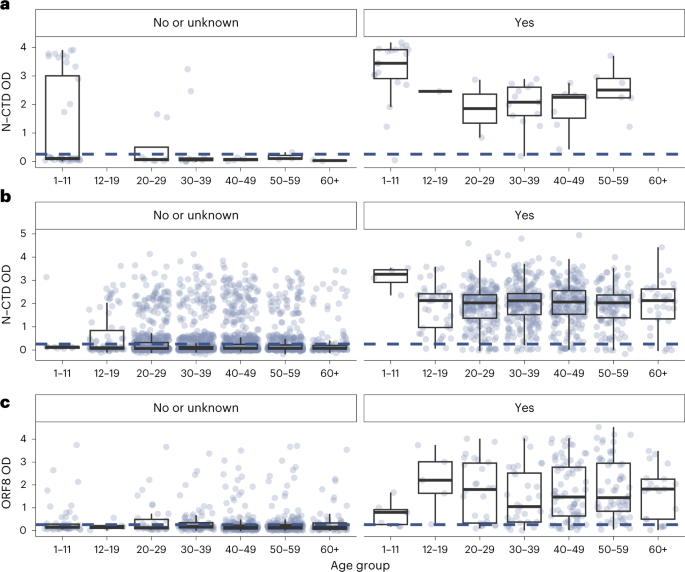
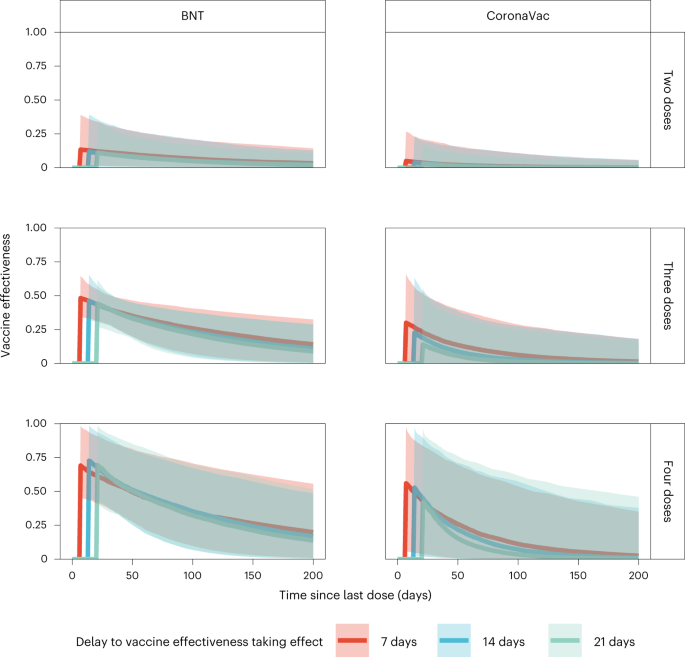
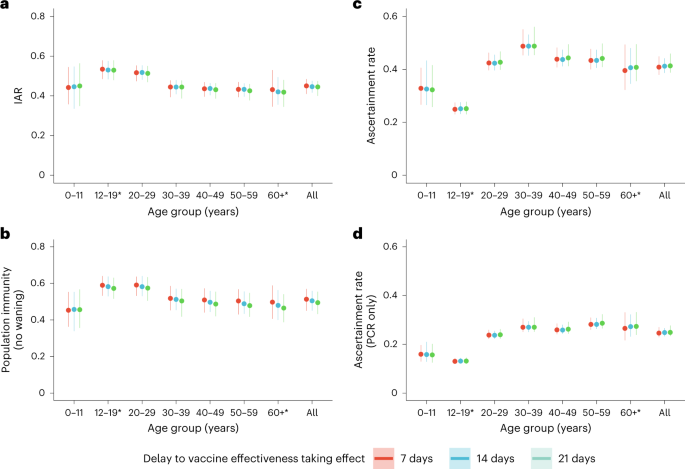
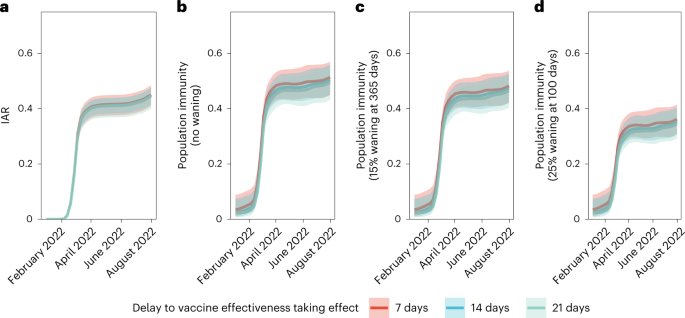
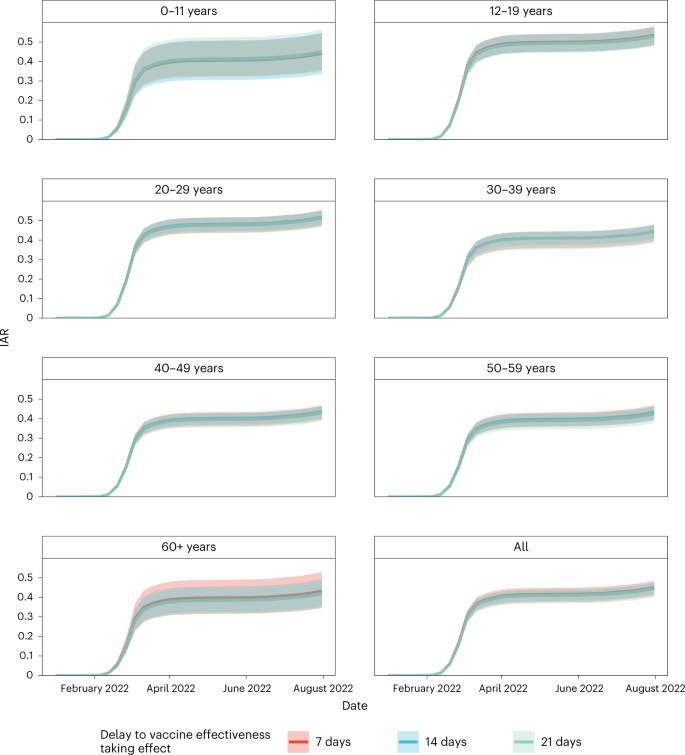
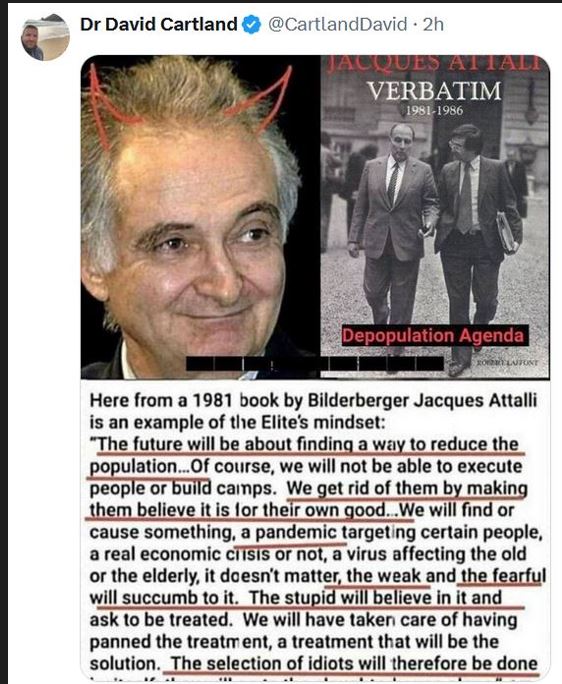
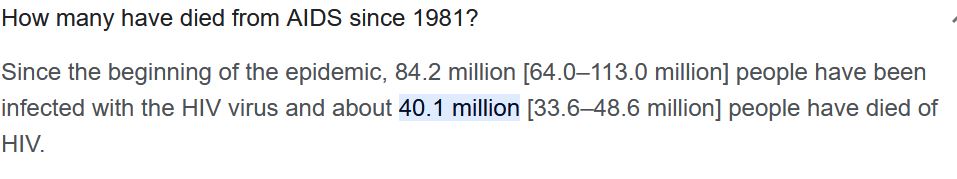
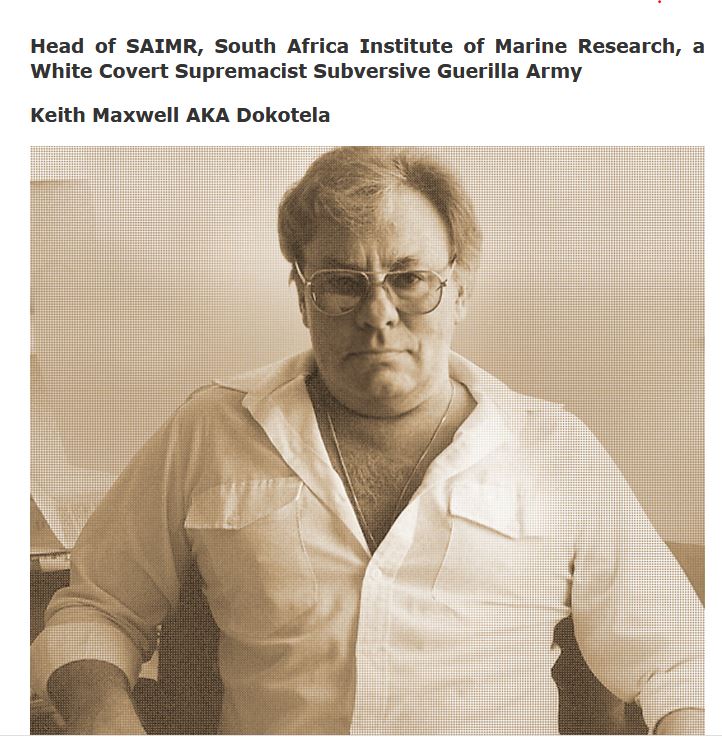
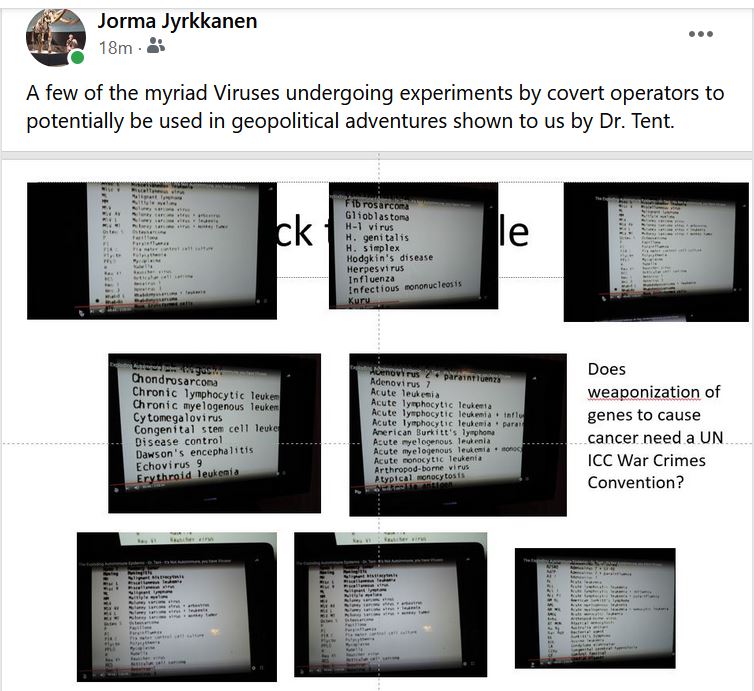
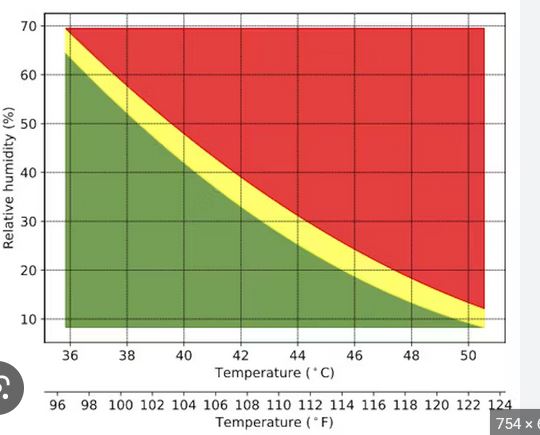
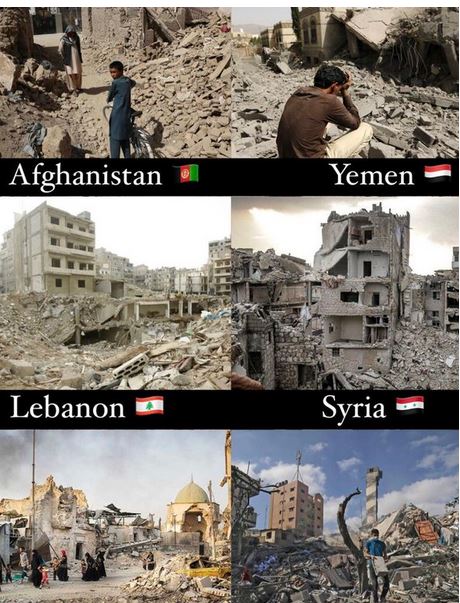
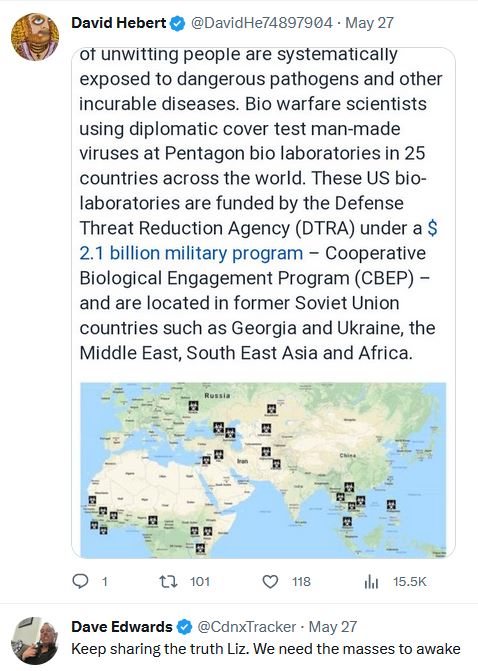
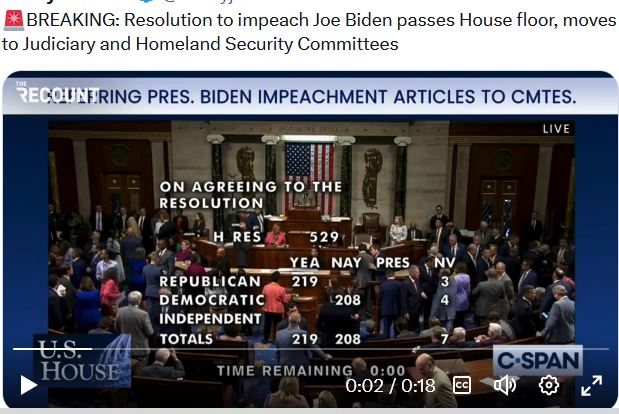
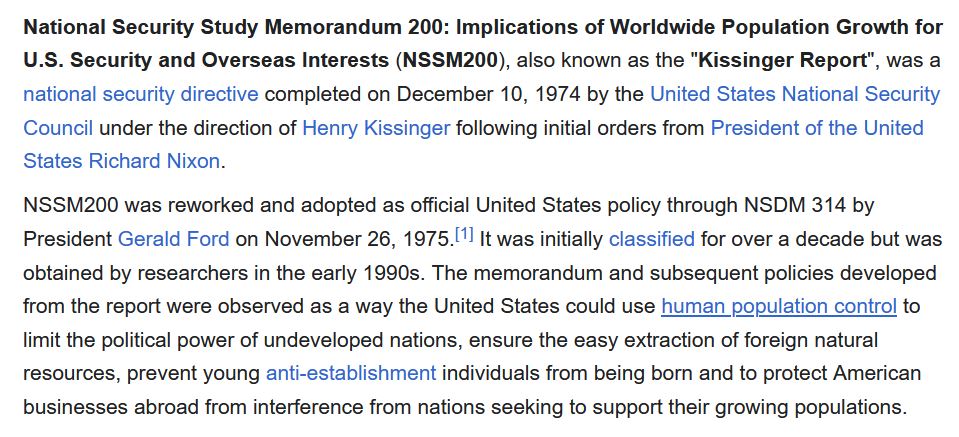
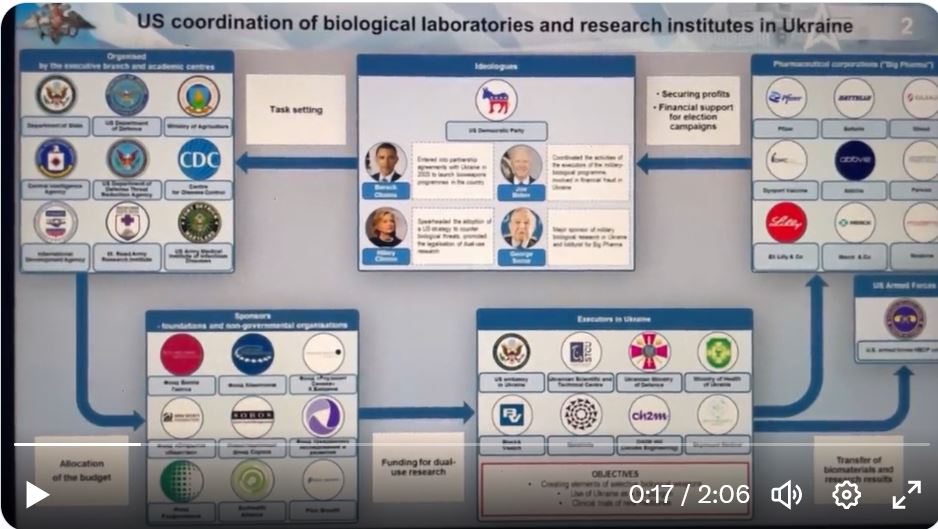
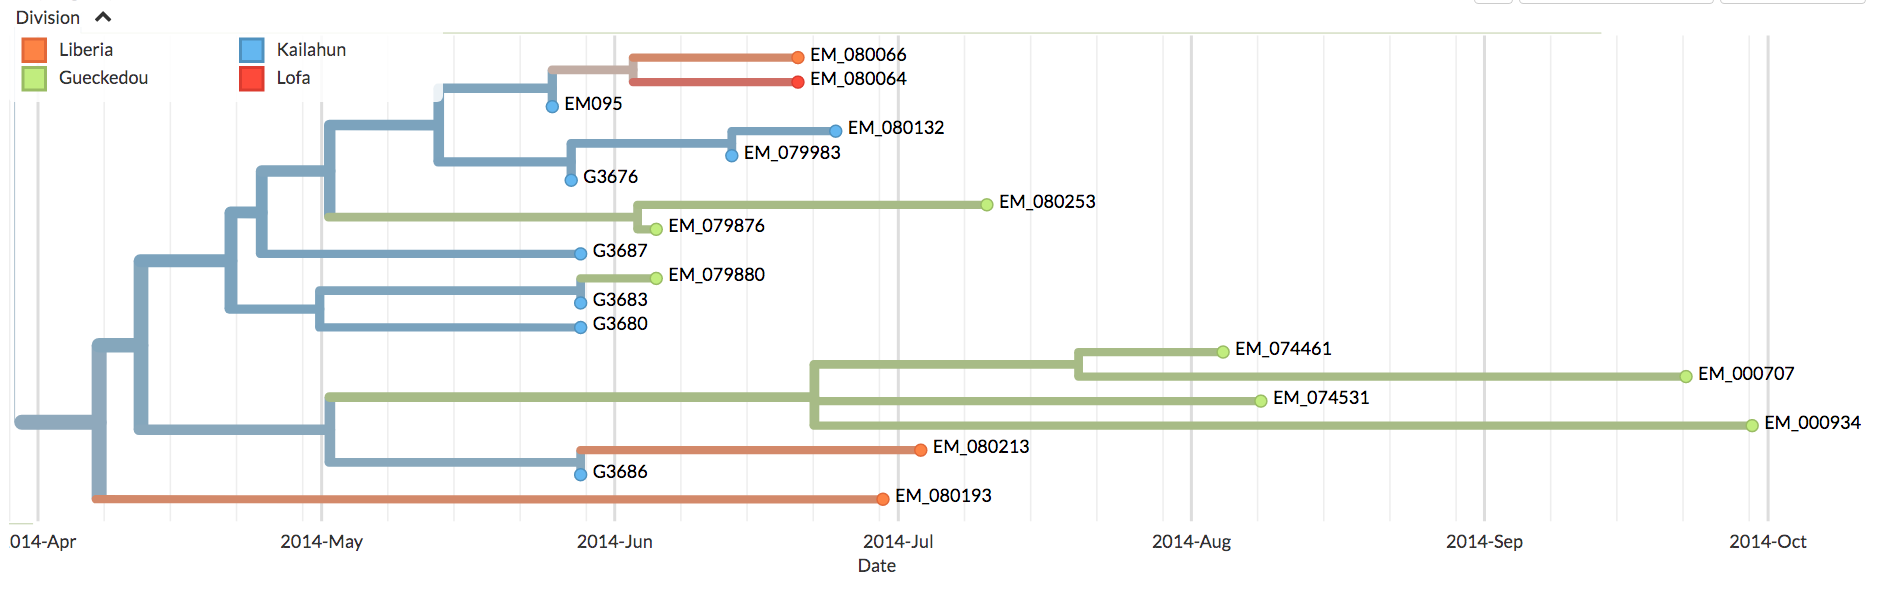
I read this pretty carefully and conclude it was most likely a lab leak inadvertant or otherwise. The Geopolitics suggests otherwise.

Smallpox Vaccination Programs and AIDS Probably Part of the Story. Was AIDS in Batches of Variola Vaccines and if so How Did it Get There? 2023-07-06. Jorma Jyrkkanen

July 6, 2023

Historical

Haiti and the Dominican Republic.

Exposure to smallpox during early Spanish attempts to convert the Native populations to plantation slavery exterminated all 3.5 million Native inhabitants of the region.

Africa

African epidemics

Variola lesions on chest and arms

One of the oldest records of what may have been an encounter with smallpox in Africa is associated with the elephant war circa AD 568 CE, when after fighting a siege in Mecca, Ethiopian troops contracted the disease which they carried with them back to Africa.[citation needed]

Arab ports in Coastal towns in Africa likely contributed to the importation of smallpox into Africa, as early as the 13th century, though no records exist until the 16th century. Upon invasion of these towns by tribes in the interior of Africa, a severe epidemic affected all African inhabitants while sparing the Portuguese. Densely populated areas of Africa connected to the Mediterranean, Nubia and Ethiopia by caravan route likely were affected by smallpox since the 11th century, though written records do not appear until the introduction of the slave trade in the 16th century.[3]

The enslavement of Africans continued to spread smallpox to the entire continent, with raiders pushing farther inland along caravan routes in search of people to enslave. The effects of smallpox could be seen along caravan routes, and those who were not affected along the routes were still likely to become infected either waiting to be put onboard or on board ships.[3]

Smallpox in Angola was likely introduced shortly after Portuguese settlement of the area in 1484. The 1864 epidemic killed 25,000 inhabitants, one third of the total population in that same area. In 1713, an outbreak occurred in South Africa after a ship from India docked at Cape Town, bringing infected laundry ashore. Many of the settler European population suffered, and whole clans of the Khoisan people were wiped out. A second outbreak occurred in 1755, again affecting both the white population and the Khoisan. The disease spread further, completely eradicating several Khosian clans, all the way to the Kalahari desert. A third outbreak in 1767 similarly affected the Khoisan and Bantu peoples. But the European colonial settlers were not affected nearly to the extent that they were in the first two outbreaks, it has been speculated this is because of variolation. Continued enslavement operations brought smallpox to Cape Town again in 1840, taking the lives of 2500 people, and then to Uganda in the 1840s. It is estimated that up to eighty percent of the Griqua tribe was exterminated by smallpox in 1831, and whole tribes were being wiped out in Kenya up until 1899. Along the Zaire river basin were areas where no one survived the epidemics, leaving the land devoid of human life. In Ethiopia and the Sudan, six epidemics are recorded for the 19th century: 1811–1813, 1838–1839, 1865–1866, 1878–1879, 1885–1887, and 1889–1890.[31]

Epidemics in the Americas

YearLocationDescription
1520–1527Mexico, Central America, South AmericaSmallpox kills 5-8 millions of native inhabitants of Mexico. Unintentionally introduced at Veracruz with the arrival of Panfilo de Narvaez on April 23, 1520, and was credited with the victory of Cortes over the Aztec empire at Tenochtitlan (present-day Mexico City) in 1521. Kills the Inca ruler, Huayna Capac, and 200,000 others and weakens the Incan Empire.
1561–1562ChileNo precise numbers on deaths exist in contemporary records but it is estimated that natives lost 20 to 25 percent of their population. According to Alonso de Góngora Marmolejo, so many Indian laborers died that the Spanish gold mines had to shut down.[33]
1588–1591Central ChileA combined smallpox, measles and typhus plague strikes Central Chile contributing to a decline of indigenous populations.[34]
1617–1619North America northern east coastKilled 90% of the Massachusetts Bay Indians
1655Chillán, Central ChileAn outbreak of smallpox occurred among refugees from Chillán as the city was evacuated amidst the Mapuche uprising of 1655. Spanish authorities put this group in effective quarantine decreeing death sentences for anyone crossing Maule River north.[35]
1674Cherokee TribeDeath count unknown. Population in 1674 about 50,000. After 1729, 1738, and 1753 smallpox epidemics their population was only 25,000 when they were forced to Oklahoma on the Trail Of Tears.
1692Boston, MA
1702–1703St. Lawrence Valley, NY
1721Boston, MAA British sailor disembarking the HMS Seahorse brought smallpox to Boston. 5759 people were infected and 844 died.
1736Pennsylvania
1738South Carolina
1770sWest Coast of North AmericaAt least 30% (tens of thousands) of the Northwestern Native Americans die from smallpox[36][37]
1781–1783Great Lakes
1830sAlaskaReduced Dena’ina Athabaskan population in Cook Inlet region of southcentral Alaska by half.[38] Smallpox also devastated Yup’ik Eskimo populations in western Alaska.
1836–1840Great Plains1837 Great Plains smallpox epidemic
1860–1861Pennsylvania
1862British Columbia, Washington state & Russian AmericaKnown as the Great Smallpox of 1862, an outbreak of smallpox in a large encampment of all indigenous peoples from around the colony on June 10, 1862, dispersed by order of the government to return to their homes, resulted in the deaths of 50-90% of the indigenous peoples in the region[39][40][41][42][43]
1865–1873Philadelphia, PA, New York, Boston, MA and New Orleans, LASame period of time, in Washington D.C., Baltimore, MD, Memphis, TN, Cholera and a series of recurring epidemics of Typhus, Scarlet Fever and Yellow Fever
1869Araucanía, southern ChileA smallpox epidemic breaks out among native Mapuches, just some months after a destructive Chilean military campaign in Araucanía.[44]
1877Los Angeles, CA
1880Tacna, PeruTacna hosted the combined armies of Peru and Bolivia before being defeated by Chile in the Battle of Tacna. Before it fell to Chileans in late May 1880 infectious diseases were widespread in the city with 461 deaths of smallpox in the 1879-1880 period, making up 11.3% of all registered deaths for the city in the same period.[45]
1902Boston, MassachusettsOf the 1,596 cases reported in this epidemic, 270 died.
1905Southern Patagonia, ChileA smallpox epidemic hits Tehuelche communities in Magallanes Territory, Chile.[46][47] Cacique José Mulato died in the epidemic.[47]


After first contacts with Europeans and Africans, some believe that the death of 90–95% of the native population of the New World was caused by Old World diseases.[48] It is suspected that smallpox was the chief culprit and responsible for killing nearly all of the native inhabitants of the Americas. For more than 200 years, this disease affected all new world populations, mostly without intentional European transmission, from contact in the early 16th century until possibly as late as the French and Indian Wars (1754–1767).[49]

In 1519 Hernán Cortés landed on the shores of what is now Mexico and what was then the Aztec Empire. In 1520 another group of Spanish arrived in Mexico from Hispaniola, bringing with them the smallpox which had already been ravaging that island for two years. When Cortés heard about the other group, he went and defeated them. In this contact, one of Cortés’s men contracted the disease. When Cortés returned to Tenochtitlan, he brought the disease with him.[citation needed]

Soon, the Aztecs rose up in rebellion against Cortés and his men. Outnumbered, the Spanish were forced to flee. In the fighting, the Spanish soldier carrying smallpox died. Cortés would not return to the capital until August 1521. In the meantime smallpox devastated the Aztec population. It killed most of the Aztec army and 25% of the overall population.[50] The Spanish Franciscan Motolinia left this description: “As the Indians did not know the remedy of the disease…they died in heaps, like bedbugs. In many places it happened that everyone in a house died and, as it was impossible to bury the great number of dead, they pulled down the houses over them so that their homes become their tombs.”[51] On Cortés’s return, he found the Aztec army’s chain of command in ruins. The soldiers who still lived were weak from the disease. Cortés then easily defeated the Aztecs and entered Tenochtitlán.[52] The Spaniards said that they could not walk through the streets without stepping on the bodies of smallpox victims.[53]

The effects of smallpox on Tahuantinsuyu (or the Inca empire) were even more devastating. Beginning in Colombia, smallpox spread rapidly before the Spanish invaders first arrived in the empire. The spread was probably aided by the efficient Inca road system. Within months, the disease had killed the Incan Emperor Huayna Capac, his successor, and most of the other leaders. Two of his surviving sons warred for power and, after a bloody and costly war, Atahualpa become the new emperor. As Atahualpa was returning to the capital Cuzco, Francisco Pizarro arrived and through a series of deceits captured the young leader and his best general. Within a few years smallpox claimed between 60% and 90% of the Inca population,[54] with other waves of European disease weakening them further. A handful of historians argue that a disease called Bartonellosis might have been responsible for some outbreaks of illness, but this opinion is in the scholarly minority.[55] The effects of Bartonellosis were depicted in the ceramics of the Moche people of ancient Peru.[56]

Even after the two largest empires of the Americas were defeated by the virus and disease, smallpox continued its march of death. In 1561, smallpox reached Chile by sea, when a ship carrying the new governor Francisco de Villagra landed at La Serena. Chile had previously been isolated by the Atacama Desert and Andes Mountains from Peru, but at the end of 1561 and in early 1562, it ravaged the Chilean native population. Chronicles and records of the time left no accurate data on mortality but more recent estimates are that the natives lost 20 to 25 percent of their population. The Spanish historian Marmolejo said that gold mines had to shut down when all their Indian labor died.[57] Mapuche fighting Spain in Araucanía regarded the epidemic as a magical attempt by Francisco de Villagra to exterminate them because he could not defeat them in the Arauco War.[33]

In 1633 in Plymouth, Massachusetts, the Native Americans were struck by the virus. As it had done elsewhere, the virus wiped out entire population groups of Native Americans. It reached Mohawks in 1634,[58] the Lake Ontario area in 1636, and the lands of the Iroquois by 1679.[59]

AIDS in Haiti

With an estimated 150,000 people living with HIV/AIDS in 2016 (or an approximately 2.1 percent prevalence rate among adults aged 15–49), Haiti has the most overall cases of HIV/AIDS in the Caribbean and its HIV prevalence rates among the highest percentage-wise in the region.[3] There are many risk-factor groups for HIV infection in Haiti, with the most common ones including lower socioeconomic status, lower educational levels, risky behavior, and lower levels of awareness regarding HIV and its transmission.[4][5]

AIDS in Sierra Leon

Sierra Leone is a low-income West African country that has dealt with waves of economic, political, and public health challenges in its recent past, including a decade-long brutal civil war and the Ebola epidemic of 2014-2016. The HIV/AIDS epidemic, which has raged on in the country since 1987, has long been characterized as stable.

AIDS in Benin

he number of adults and children living with HIV/AIDS in Benin in 2003 was estimated by the Joint United Nations Programme for HIV/AIDS (UNAIDS) to range between 38,000 and 120,000, with nearly equal numbers of males and females. A recent study conducted by the National AIDS Control Program estimated the number of people living with HIV/AIDS to be 71,950. In 2003, an estimated 6,140 adults and children died of AIDS. Benin has a well-functioning system of antenatal HIV surveillance; in 2002, the median HIV prevalence at 36 antenatal clinics was 1.9%. Another study in 2002 showed an overall prevalence of 2.3% among adults in Cotonou, Benin’s largest city.[1]

AIDS in Niger

Prevalence

2007 estimates put the number of HIV positive Nigeriens at 60,000 or 0.8% of total population, with 4,000 deaths in that year.[1] United Nations estimates in 2008 gave similar figures, giving Niger one of the lowest infection rates on the continent.[2]

2008 estimates ranged from 44,000 to 85,000 people living with HIV in a nation of around 14 million, with an adult (aged 15 to 49) prevalence rate of between 0.6% and 1.1%. Adults aged 15 and up living with HIV were estimated to range from 42,000 to 81,000, with women of this age range making up about a third (12,000 to 26,000). Estimates of children (under 14) living with HIV were between 2,500 and 4,200. Total deaths were estimated to be between 3,000 and 5,600 per year. Aids orphans (under 17) were estimated at between 18,000 and 39,000.[2]

AIDS in Tanzania

Tanzania faces generalized HIV epidemic which means it affects all sections of the society but also concentrated epidemic among certain population groups. The prevalence of HIV/AIDS in Tanzania is characterised by substantial across age, gender, geographical location and socioeconomic status implying difference in the risk of transmission of infection.[1] In 2019, among 1.7 million people living with HIV/AIDS, the prevalence was 4.6% and 58,000 new HIV infection among 15–49 years old, and 6,500 new infections among children below 15 years old,[1] 50% of all new infections are between 15 – 29 years of age group.[2] Report from Tanzania PHIA of 2016/17 shows that HIV prevalence among women is higher (6.2%) than men (3.1%).[3] The prevalence of HIV is less than 2% among 15-19 years for both males and females and then increases with age for both sexes.[1]

AIDS in Congo

The Democratic Republic of the Congo is facing a large-scale growing HIV/AIDS epidemic, with an estimated national average adult prevalence of 4% and 1.19 million people living with HIV/AIDS at the end of 2005. The principal mode of transmission is heterosexual.

AIDS in Nigeria

HIV/AIDS originated in Africa during early 20th century and is a major public health concern and cause of death in many African countries. AIDS rates varies significantly between countries, though the majority of cases are concentrated in Southern Africa. Although the continent is home to about 15.2 percent of the world’s population,[1] more than two-thirds of the total infected worldwide – some 35 million people – were Africans, of whom 15 million have already died.[2]Eastern and Southern Africa alone accounted for an estimate of 60 percent of all people living with HIV[3] and 70 percent of all AIDS deaths in 2011.[4] The countries of Eastern and Southern Africa are most affected, AIDS has raised death rates and lowered life expectancy among adults between the ages of 20 and 49 by about twenty years.[2] Furthermore, the life expectancy in many parts of Africa is declining, largely as a result of the HIV/AIDS epidemic with life-expectancy in some countries reaching as low as thirty-nine years.

Conclusion

While there is some correlation in is not sufficient to prove causation even though it is suspicious,

Lipid Peroxide Titre as an Indicator of Severity of Covid Infection, a Consequence of Damage to the Critical Cardiovascular and other vital organ Mitochondria. Note to clinical practitioners.

July 2, 2023

Jorma A Jyrkkanen, Bsc, PDP, Researcher. 2023-07-02

My Concerns

It has been found that antibiotic treatment will lead to an increase of reactive oxygen and lipid peroxide, two potential mutagens and carcinogens and this may even rupture the mitochondria with subsequent serious loss of immune and metabolic functionality, for example loss of oxidative phosphorylation, ATP and NAD and increased immune dysfunction leading to cardiovascular pathologies and increased cancers. Chinese researchers also found that a number of common pesticides will also rupture mitochondria. This may lead to similar results. The big surprise was that covid virus may also attacks and destroy the mitochondria. Will the vaccine likewise have deleterious effects on mitochondrial contributions? From these findings it is no surprise that lipid peroxide titre in patients has been found to coincide with severity of the infection. To my astonishment antibiotics were administered to severely ill covid patients and it came as no surprise to me that so many died. Did the antibiotic contribute to their deaths? I suspect that it did.

What needs to happen is body burden and past history of antibiotics use and type of antibiotic need to be assessed in every case, and exposures to common pesticides as well before any administration and lipid peroxide titre needs to be taken into account. The Mitochondria is after all an ancient bacteria and is vulnerable to biocides and this must be taken into consideration. Mitochondria are also absolutely critical for normal cardiovascular and immune function so all care and attention must be taken to ensure no damage occurs to this organelle by any treatment.

Key Words

lipid peroxide, indicator of covid infection severity, antibiotics, pesticides, mRNA vaccine

METABIOTA Distributor of Money for Pentagons Global Biowarfare Program. 2023-06-20. clandestine release Twitter.

June 20, 2023

SEE ALSO https://jormajyrkkanen.ca/2023/01/13/jorma-antero-jyrkkanens-bibliography-2022/

Metabiota was the vehicle apparently that distributed funds worldwide to the Pentagons Secret Global Biological Warfare Labs

IRS TO OPEN WHISTLEBLOWER FILE ON HUNTER

Breaking Vote to Impeach Biden Passes first Test.

Hunter Biden via Metabiota and Rosemont Seneca helped secure funds for US-DND-Ukraine Biolabs for Experiments.

Is this not a crime.

Winnipeg Level IV Biology Lab Fires 2 Chinese Scientists who Sent Ebola and Henipah virus Samples to Wuhan and Terminates Chinese Students Access.

June 15, 2023

Public Health Agency refusing to disclose uncensored documents on Winnipeg virus lab

Foreign affairs critic wants to know what Canada’s role was in training, equipping Wuhan virology lab

Karen Pauls · CBC News · Posted: May 11, 2021 2:40 PM PDT | Last Updated: May 11, 2021

Dr. Xiangguo Qiu at the at the National Microbiology Laboratory (NML) in Winnipeg. A special parliamentary committee on Canada-China relations wants to know why she and her husband were let go from the lab amid an RCMP investigation. (CBC)

As the Public Health Agency of Canada refuses to release uncensored internal documents, a Conservative MP says he wants to know how far Canada’s collaboration with China on Level-4 pathogens went — and why two federal scientists were let go by the National Microbiology Lab in Winnipeg in January.

“We need these documents. We need to know what the Government of Canada was doing through the National Microbiology Lab in Winnipeg with respect to cooperating with the Wuhan Institute of Virology in Wuhan, China,” Conservative foreign affairs critic Michael Chong said during a special parliamentary committee hearing on Canada-China relations Monday night.

The special committee has demanded to know why two federal government scientists were escorted out of Canada’s only Level 4 Lab in July 2019, just four months after one of them shipped samples of the Ebola and Henipah viruses to the Wuhan Institute of Virology in China — stories first published by CBC News.

Henipah Virus, Bats Rodents, Other Mammals, Humans Highly Fatal.

[Jyrkkanen Comm 2023. This virus has the potential to be abused and made more potent with gain of function attributes for dispersion and person to person contagion as a biowarfare agent and to act as a vector for population decline by a malevolent state biowarfare agency and as a tool to implement the NWO and Great Reset the Group of 300 and WEF are trying to achieve. Combined with EBola it would have enormous lethality.]

Two months after that shipment, on May 24, 2019, the Public Health Agency of Canada (PHAC) referred an “administrative matter” to RCMP that resulted in the removal of two Chinese research scientists — Xiangguo Qiu and her husband, Keding Cheng — and several international students on July 5.

Conservative MP Michael Chong says he wants to know why two scientists were let go from the National Microbiology Lab, why the RCMP is investigating them and whether the training the Winnipeg lab has given its counterpart in Wuhan, China has any connection with the origins of the COVID-19 pandemic. (Sean Kilpatrick/The Canadian Press)

The committee says it wants to know why Xiangguo Qiu and Keding Cheng were let go this past January.

“The Canadian public has the right to know what the extent of that cooperation was, why these two scientists there were terminated, and what exactly happened with the transfer of Henipah and Ebola viruses and any other workings and goings on between a Government of Canada institution and this virology lab in Wuhan,” Chong said.

Despite repeated requests from the committee, PHAC has refused to answer those questionsor provide uncensored internal documents, saying it can’t release personal information under federal privacy laws.

It did provide 271 pages of documents to the committee in advance of Monday’s meeting, but much of it was censored.

“We’ve redacted documents where the information pertains to personal information, investigations or security matters. The reason we’ve done so is that, as public servants, we’re bound by law to keep confidential information confidential,” PHAC president Iain Stewart told the committee.

“It’s not that we’re wishing to be uncooperative or unresponsive. We are disclosing as much as we can within the limits of the law.”

Iain Stewart, president of the Public Health Agency of Canada, says federal privacy law prevents him from sharing personal information about the two scientists let go from the National Microbiology Lab in Winnipeg. (National Research Council/Twitter)

Liberal MP Robert Oliphant, parliamentary secretary to the Minister of Foreign Affairs, told Stewart he should get a second opinion on that.

“I think the Justice Department is not giving you the best advice,” he said.

Stewart did provide more information on the shipment of Ebola and Henipah samples from Winnipeg to the Wuhan lab. He said the shipment was done properly.

“While this is the only time that we have shared virus samples with this particular lab, collaboration with labs outside of Canada are critical to advance public health research into infectious diseases,” he said.

“Given our standing as a collaborating partner for viral fever viruses, as well as our knowledge on regulations and standards for these types of transfers, the laboratory in Winnipeg is often asked to provide materials to new or existing programs, including laboratories in the United States.

“The [National Microbiology Lab] is open to providing materials in a safe, responsible and transparent fashion with other labs in order to foster global collaboration rather than enable research on any given disease to be monopolized by specific teams.”

Right to know

Conservative human rights critic Garnett Genuis said there is a precedent in a 2010 ruling for fulfilling the committee’s request for unredacted documents.

That ruling by the Speaker of the House of Commons found the Harper government breached parliamentary privilege when it refused to produce uncensored documents on the treatment of Afghan detainees. It ordered that the material be turned over to MPs.

Chong said Canadians have a right to know the full back story and the committee has the legal right to compel the release of unredacted documents.

He asked some pointed questions about what the National Microbiology Lab did to build up the capacity of its counterpart in Wuhan, China — a virology lab some have tried to link to the origins of the COVID-19 pandemic. Those theories have not been substantiated.

“There are two theories about how the coronavirus emerged. One is that it was zoonotic,” Chong told the committee. A zoonotic virus is one that jumps from an animal species to humans.

“The other is that it somehow came out of this National Institute of Virology lab in Wuhan,” he continued. “This is not in some dark part of the web driven by conspiracies. These are reputable people raising very real questions.”

‘Far-fetched ideas’

Liberal MP Peter Fragiskatos accused Chong of spreading disinformation.

“Mr. Chong is proceeding to connect dots here that, you know, he is borrowing from some of the wildest theories on Facebook and other social media to make a point here that is irrelevant to this committee,” he said.

Oliphant said he agrees the documents should be released but called Chong’s comments irresponsible.

“What I am disagreeing with is far-fetched ideas that even hint at some association that makes no sense. And that somehow there is something embedded in these documents that’s going to solve the world’s question about where the coronavirus COVID-19 came from,” Oliphant said.

“That’s bad rhetoric. I think it’s misinformation. I think it’s drawing associations that should not be drawn together at a committee of Parliament. And I think it just cedes the oddest ideas in other people’s heads.”

The National Microbiology Lab in Winnipeg is Canada’s only Level-Four lab, capable of working with the world’s deadliest pathogens. (Trevor Lyons/CBC)

In interview Tuesday with CBC News, Chong clarified and backtracked slightly, saying he was not associating Canada’s lab with the origins of the coronavirus pandemic. He said he merely questioned Canada’s role in training and equipping the lab in Wuhan to get Level-4 certification.

“If it turns out that the Wuhan Institute of Virology is the source of the coronavirus that started this global pandemic, then we need a lot more oversight of the National Microbiology Lab in Winnipeg and the role it played in helping build capacity,” Chong said.

No connections, PHAC says

The RCMP and PHAC have consistently denied any connections between the COVID-19 pandemic and the virus shipments. There is no evidence linking the shipment to the spread of the coronavirus. Ebola is a filovirus and Henipah is a paramyxovirus — the Winnipeg lab sent no coronavirus samples to Wuhan, PHAC said.

“They are not, in fact, at all related and would not have been used or relevant to SARS-CoV-2,” the lab’s scientific director-general, Dr. Guillaume Poliquin, told the committee Monday.

At the conclusion of the meeting, members of the committee passed a motion demanding that unredacted copies of all PHAC records on the matter be turned over to the House of Commons law clerk for review within 10 days.

The committee would then meet in secret to determine what could be released publicly.

The committee also voted to send the matter to the House of Commons if PHAC refuses to produce the documents. Parliament would then be asked to demand disclosure.

My Comment: The secrecy and intransigence in releasing information about details and the manner of treatment of fellow researcher of extra-national origin suggests the Winnipeg lab is a Military Lab and is possibly covertly contracting to the US DOD at the Pentagon. If it were pure science for global public health there would be full and open sharing of scientific data and samples. It wreaks of a probable role for Canada in Biological weapons proliferation.

Expose’ on security breeches were enabled by the Winnipeg Labs collusion with the People’s Liberation Army Biowarfare Agencies.

https://www.youtube.com/watch?v=O676UFKGv90

The Problem is that Vaccines Developed by Canada with dual civilian use military use potential if gained by China means those pathogens cannot be used against China because it confers protection on them. This would compromise offensive use of those pathogens by biowarfare partners in America against China. If they were being developed for international medical public health use their production methodology would be published in peer reviewed medical journals like Nature Medicine or Virology. The scandal exposes the Winnipeg lab as a Partner agency in global biowarfare. ex:

https://jormajyrkkanen.ca/2023/05/29/pentagon-global-biowarfare-program-liz-churchill-2023-05-29-analyst-jorma-jyrkkanen-scientist/

Effectiveness of Covid Vaccines. 2023-06-14. Jorma Jyrkkanen, Analyst.

June 15, 2023

Bivalent Vaccine

As a library, NLM provides access to scientific literature. Inclusion in an NLM database does not imply endorsement of, or agreement with, the contents by NLM or the National Institutes of Health. Learn more about our disclaimer.

Logo of ofid

Open Forum Infect Dis. 2023 Jun; 10(6): ofad209.

Published online 2023 Apr 19. doi: 10.1093/ofid/ofad209

PMCID: PMC10234376

PMID: 37274183

Effectiveness of the Coronavirus Disease 2019 Bivalent Vaccine

Nabin K Shrestha,Patrick C Burke, Amy S Nowacki, James F Simon, Amanda Hagen, and Steven M Gordon

Author informationArticle notesCopyright and License informationDisclaimer

Go to:

Abstract

Background

The purpose of this study was to evaluate whether a bivalent coronavirus disease 2019 (COVID-19) vaccine protects against COVID-19.

Methods

The study included employees of Cleveland Clinic in employment when the bivalent COVID-19 vaccine first became available. Cumulative incidence of COVID-19 over the following 26 weeks was examined. Protection provided by vaccination (analyzed as a time-dependent covariate) was evaluated using Cox proportional hazards regression, with change in dominant circulating lineages over time accounted for by time-dependent coefficients. The analysis was adjusted for the pandemic phase when the last prior COVID-19 episode occurred and the number of prior vaccine doses.

Results

Among 51 017 employees, COVID-19 occurred in 4424 (8.7%) during the study. In multivariable analysis, the bivalent-vaccinated state was associated with lower risk of COVID-19 during the BA.4/5-dominant (hazard ratio, 0.71 [95% confidence interval, .63–79]) and the BQ-dominant (0.80 [.69–.94]) phases, but decreased risk was not found during the XBB-dominant phase (0.96 [.82–.1.12]). The estimated vaccine effectiveness was 29% (95% confidence interval, 21%–37%), 20% (6%–31%), and 4% (−12% to 18%), during the BA.4/5-, BQ-, and XBB-dominant phases, respectively. The risk of COVID-19 also increased with time since the most recent prior COVID-19 episode and with the number of vaccine doses previously received.

Conclusions

The bivalent COVID-19 vaccine given to working-aged adults afforded modest protection overall against COVID-19 while the BA.4/5 lineages were the dominant circulating strains, afforded less protection when the BQ lineages were dominant, and effectiveness was not demonstrated when the XBB lineages were dominant.

Keywords: COVID-19, SARS-CoV-2, bivalent vaccine, effectiveness, vaccines

When the original messenger RNA (mRNA) coronavirus disease 2019 (COVID-19) vaccines first became available in 2020, there was ample evidence of efficacy from randomized clinical trials [1, 2].Vaccine effectiveness was subsequently confirmed by clinical effectiveness data in the real world outside of clinical trials [3, 4], including an effectiveness estimate of 97% among employees within our own healthcare system [5]. This was when the human population had just encountered the novel severe acute respiratory syndrome coronavirus 2 (SARS-CoV-2) virus, and the pathogen had exacted a high morbidity and mortality burden across the world. The vaccines were amazingly effective in preventing COVID-19, saved a large number of lives, and changed the impact of the pandemic.

Continued acquisition of mutations in the virus, from natural evolution in response to interaction with the immune response among the human population, led to the emergence and spread of SARS-CoV-2 variants. Despite this, for almost 2 years since the onset of the pandemic, those previously infected or vaccinated continued to have substantial protection against reinfection by virtue of natural or vaccine-induced immunity [6]. The arrival of the Omicron variant in December 2021 brought a significant change to the immune protection landscape. Previously infected or vaccinated individuals were no longer protected from COVID-19 [6]. Vaccine boosting provided some protection against the Omicron variant [7, 8], but the degree of protection was not near that of the original vaccine against the pre-Omicron variants of SARS-CoV-2 [8]. After the emergence of the Omicron variant, prior infection with an earlier lineage of the Omicron variant protected against subsequent infection with a subsequent lineage [9], but such protection appeared to wear off within a few months [10]. During the Omicron phase of the pandemic, protection from vaccine-induced immunity decreased within a few months after vaccine boosting [8].

Recognition that the original COVID-19 vaccines provided much less protection after the emergence of the Omicron variant spurred efforts to produce newer vaccines that were more effective. These efforts culminated in the approval by the US Food and Drug Administration, on 31 August 2022, of bivalent COVID-19 mRNA vaccines, which encoded antigens represented in the original vaccine as well as antigens representing the BA.4/5 lineages of the Omicron variant. Given the demonstrated safety of the earlier mRNA vaccines and the perceived urgency of need of a more effective preventive tool, these vaccines were approved without demonstration of effectiveness in clinical studies. The purpose of this study was to evaluate whether the bivalent COVID-19 vaccine protects against COVID-19.

Go to:

METHODS

Study Design

This was a retrospective cohort study conducted at the Cleveland Clinic Health System (Cleveland, Ohio) in the United States.

Patient Consent Statement

The study was approved by the Cleveland Clinic Institutional Review Board as exempt research (IRB no. 22–917). Waivers of informed consent and of HIPAA (Health Insurance Portability and Accountability Act) authorization were approved to allow the research team access to the required data.

Setting

Since the arrival of the COVID-19 pandemic at Cleveland Clinic in March 2020, employee access to testing has been a priority. Voluntary vaccination for COVID-19 began on 16 December 2020, and the monovalent mRNA vaccine as a booster became available to employees on 5 October 2021. The bivalent COVID-19 mRNA vaccine was first offered to employees on 12 September 2022. This date was considered the study start date. The mix of circulating variants of SARS-CoV-2 changed over the course of the study. The majority of infections in Ohio were initially caused by the BA.4 or BA.5 lineages of the Omicron variant. By mid-December 2022 the BQ lineages, and by mid-January 2023 the XBB lineages of the Omicron variant were the dominant circulating strains [11].

Study Participants

The study included Cleveland Clinic Health System employees in employment at any Cleveland Clinic location in Ohio on 12 September 2022, the day the bivalent vaccine first became available to employees. Those for whom age and sex were not available were excluded.

Variables

The covariates collected were age, sex, job location, and job type categorized into clinical or nonclinical, as described in our earlier studies [5–7]. Institutional data governance rules related to employee data limited our ability to supplement our data set with additional clinical variables. Employees were considered prepandemic hires if hired before 16 March 2020, the day COVID-19 testing became available in our institution, and pandemic hires if hired on or after that date.

Prior COVID-19 was defined as a positive nucleic acid amplification test (NAAT) result for SARS-CoV-2 any time before the study start date. The date of infection for a prior episode of COVID-19 was the date of the first positive test for that episode of illness. A positive test >90 days after the date of a previous infection was considered a new episode of infection. Since the health system never had a requirement for systematic asymptomatic employee test screening, most positive test results would have been from tests done to evaluate suspicious symptoms. Some would have been tests done to evaluate known exposures or for preoperative or preprocedural screening. The pandemic phase (pre-Omicron or Omicron) during which a study participant had his or her last prior episode of COVID-19 was also collected as a variable, based on which variant/lineages accounted for >50% of infections in Ohio at the time [11].

Outcome

The study outcome was time to COVID-19, the latter defined as a positive NAAT result for SARS-CoV-2 any time after the study start date. Outcomes were followed up until 14 March 2023, allowing for evaluation of outcomes up to 26 weeks from the study start date.

Statistical Analysis

A Simon-Makuch hazard plot [12] was created to compare the cumulative incidence of COVID-19 in the bivalent-vaccinated and nonvaccinated states, by treating bivalent vaccination as a time-dependent covariate. Study participants were considered bivalent vaccinated 7 days after receipt of a single dose of the bivalent COVID-19 vaccine. Those whose employment was terminated during the study period before they had COVID-19 were censored on the date of termination. Curves for the nonvaccinated state were based on data while the bivalent vaccination status of participants remained “nonvaccinated.” Curves for the bivalent-vaccinated state were based on data from the date the bivalent vaccination status changed to “vaccinated.”

Multivariable Cox proportional hazards regression models were fitted to examine the association of various variables with time to COVID-19. Bivalent vaccination was included as a time-dependent covariate [13]. The study period was divided into BA.4/5-dominant, BQ-dominant, and XBB-dominant phases, depending on which group of lineages accounted for >50% of all COVID-19 infections at the time (based on variant proportion data from the Centers for Disease Control and Prevention [CDC]) [11] and which group of lineages was most abundant in our internal sequencing data. Time-dependent coefficients were used to separate out the effects of the bivalent vaccine during the different phases.

The primary model included all study participants. The secondary model included only those with prior exposure to SARS-CoV-2 by infection or vaccination and evaluated the effect of bivalent vaccination with inclusion of time since most recent exposure to SARS-CoV-2 by infection or vaccination, to adjust for the effect of waning immunity on susceptibility to COVID-19. The possibility of multicollinearity in the models was evaluated using variance inflation factors. The proportional hazards assumption was checked using log(−log[survival]) versus time plots. Vaccine effectiveness was calculated from the hazard ratios (HRs) for bivalent vaccination in the models. The analysis was performed by N. K. S. and A. S. N. using the survival package and R software, version 4.2.2 (R Foundation for Statistical Computing) [13–15].

Go to:

RESULTS

Of 51 982 eligible study participants, 965 (1.9%) were excluded because of missing age or sex. Of the remaining 51 017 employees included, 3294 (6.5%) were censored during the study because of termination of employment. By the end of the study, 13 134 (26%) had received the bivalent vaccine, which was the Pfizer vaccine in 11 397 (87%) and the Moderna vaccine in the remaining 1700. In all, 4424 employees (8.7%) acquired COVID-19 during the 26 weeks of the study.

Baseline Characteristics

Table 1 shows the characteristics of participants included in the study. Notably, this was a relatively young population, with a mean age of 42 years. Among these individuals, 20 686 (41%) had previously had a documented episode of COVID-19, and 13 717 (27%) had previously had an Omicron variant infection; 45 064 (88%) had previously received ≥1 dose of vaccine, 42 550 (83%) had received ≥2 doses, and 46 761 (92%) had been previously exposed to SARS-CoV-2 by infection or vaccination.

Table 1.

Baseline Characteristics of 51 017 Employees of Cleveland Clinic in Ohio

CharacteristicEmployees, No. (%)a
Age in years, mean (SD)42.3 (13.4)
Sex
 Female38 052 (74.6)
 Male12 965 (25.4)
Location
 Cleveland Clinic Main Campus20 495 (40.2)
 Cleveland area regional hospitals12 039 (23.6)
 Ambulatory centers8865 (17.4)
 Cleveland Clinic Akron4301 (8.4)
 Administrative centers4141 (8.1)
 Cleveland Clinic Medina1176 (2.3)
Hire cohort
 Prepandemic34 509 (67.6)
 Pandemic16 508 (32.4)
Human resources job classification
 Clinical25 795 (50.6)
 Nonclinical25 222 (49.4)
Pandemic phase when most recent infection occurred
 Not previously infected30 331 (59.4)
 Pre-Omicron6969 (13.7)
 Omicron13 717 (26.9)
Time since most recent infection, mean (SD), d287 (220)
No. of prior vaccine doses
 05953 (11.7)
 12514 (4.9)
 214 985 (29.4)
 323 607 (46.3)
 43850 (7.5)
 591 (<1)
 617 (<1)
Time since most recent vaccine, mean (SD), 3319 (135)
Time since proximate SARS-CoV-2 exposure, mean (SD)b263 (142)

Open in a separate window

Abbreviations: SARS-Cov-2, severe acute respiratory syndrome; SD, standard deviation.

aData represented no. (%) of employees unless otherwise indicated.

bExposure by infection or vaccination.

Risk of COVID-19 Based on Prior Infection and Vaccination History

The risk of COVID-19 varied by the phase of the epidemic in which the study participant’s last prior COVID-19 episode occurred. In decreasing order of risk were those never previously infected, those last infected during the pre-Omicron phase, and those last infected during the Omicron phase (Figure 1). The risk of COVID-19 also varied by the number of COVID-19 vaccine doses previously received. The higher the number of vaccines previously received, the higher the risk of contracting COVID-19 (Figure 2).

An external file that holds a picture, illustration, etc.
Object name is ofad209f1.jpg

Figure 1.

Cumulative incidence of coronavirus disease 2019 (COVID-19) for study participants stratified by the pandemic phase when the participant’s last prior COVID-19 episode occurred. Day 0 was 12 September 2022, the date the bivalent vaccine was first offered to employees. Point estimates and 95% confidence intervals are jittered along the x-axis to improve visibility.

An external file that holds a picture, illustration, etc.
Object name is ofad209f2.jpg

Figure 2.

Cumulative incidence of coronavirus disease 2019 (COVID-19) for study participants stratified by the number of COVID-19 vaccine doses previously received. Day 0 was 12 September 2022, the date the bivalent vaccine was first offered to employees. Point estimates and 95% confidence intervals are jittered along the x-axis to improve visibility.

Bivalent Vaccine Effectiveness

The cumulative incidence of COVID-19 was similar for the bivalent-vaccinated and non–bivalent-vaccinated states in an unadjusted analysis (Figure 3). In a multivariable Cox proportional hazards regression model, adjusted for age, sex, hire cohort, job category, number of COVID-19 vaccine doses before study start, and epidemic phase when the last prior COVID-19 episode occurred, bivalent vaccination provided some protection against COVID-19 while the BA.4/5 lineages were the dominant circulating strains (HR, 0.71 [95% confidence interval (CI)], .63–.79; P <.001), and less protection while the BQ lineages were dominant (0.80 [.69–.94]; P= .005).

An external file that holds a picture, illustration, etc.
Object name is ofad209f3.jpg

Figure 3.

Simon-Makuch plot comparing the cumulative incidence of coronavirus disease 2019 (COVID-19) for the bivalent-vaccinated and non–bivalent-vaccinated states. Day 0 was 12 September 2022, the date the bivalent vaccine was first offered to employees. Point estimates and 95% confidence intervals are jittered along the x-axis to improve visibility.

A protective effect of bivalent vaccination could not be demonstrated while the XBB strains were dominant (HR, 0.96 [95% CI, .82–.1.12]; P = .59). Point estimates and 95% CIs for HRs for the variables included in the unadjusted and adjusted Cox proportional hazards regression models are shown in Table 2. The calculated overall bivalent vaccine effectiveness from the model was 29% (95% CI, 21%–37%) during the BA.4/5-dominant phase, 20% (6%–31%) during the BQ-dominant phase, and 4% (−12% to 18%) during the XBB-dominant phase. The multivariable analysis also found that, the more recent the last prior COVID-19 episode was the lower the risk of COVID-19, and the greater the number of vaccine doses previously received the higher the risk of COVID-19.

Table 2.

Unadjusted and Adjusted Associations With Time to Coronavirus Disease 2019

VariableUnadjusted HR (95% CI)P ValueAdjusted HR (95% CI)aP Value
Bivalent-vaccinated stateb
 BA.4/5-dominant phase.85 (.76–.95).005.71 (.63–.79)<.001
 BQ-dominant phase.98 (.85–1.14).81.80 (.69–.94).005
 XBB-dominant phase1.17 (1.01–1.36).04.96 (.82–1.12).59
Age1.003 (1.000–1.005).02.997 (.995–1.000).046
Male sexc.78 (.72–.84)<.001.75 (.70–.80)<.001
Pandemic hired.92 (.86–.98).01.96 (.89–1.03).24
Clinical jobe1.12 (1.05–1.18)<.0011.15 (1.09–1.23)<.001
Last prior infection phasef
 Pre-Omicron2.06 (1.85–2.31)<.0012.20 (1.97–2.46)<.001
 No known prior infection2.35 (2.15–2.56)<.0012.55 (2.34–2.79)<.001
No. of prior vaccine dosesg
 11.91 (1.57–2.32)<.0012.07 (1.70–2.52)<.001
 22.22 (1.92–2.56)<.0012.50 (2.17–2.89)<.001
 32.69 (2.35–3.09)<.0013.10 (2.69–3.56)<.001
 >32.94 (2.50–3.45)<.0013.53 (2.97–4.20)<.001

Open in a separate window

Abbreviations: CI, confidence interval; HR, hazard ratio.

aFrom a multivariable Cox-proportional hazards regression model, with bivalent-vaccinated state treated as a time-dependent covariate and time-dependent coefficients used to separate effects during the period of dominance of the Omicron BA.4/5, BQ, and XBB lineages.

bTime-dependent covariate.

cReference: female sex.

dReference: prepandemic hire.

eReference: nonclinical job.

fReference: Omicron.

gReference: 0 doses.

Bivalent Vaccine Effectiveness Among Those With Prior SARS-CoV-2 Infection or Vaccination

Among persons with prior exposure to SARS-CoV-2 by infection or vaccination, HRs for bivalent vaccination for individuals, after adjusting for time since proximate SARS-CoV-2 exposure, are shown in Table 3. Bivalent vaccination protected against COVID-19 during the BA.4/5-dominant phase (HR, 0.78 [95% CI, .70–.88; P <.001), but a significant protective effect could not be demonstrated during the BQ-dominant phase (0.91 [.78–.1.07]; P = .25) or the XBB-dominant phase (1.05 [.85–.1.29]; P= .66).

Table 3.

Associations With Time to Coronavirus Disease 2019 Among Study Participants With Prior Severe Acute Respiratory Syndrome (SARS-CoV-2) Exposure, Adjusted for Time Since Proximate SARS-CoV-2 Exposure by Prior Infection or Vaccination

VariableaAdjusted HR (95% CI)P Value
Bivalent-vaccinated stateb
 BA.4/5-dominant phase.78 (.69–.87)<.001
 BQ-dominant phase.90 (.78–1.05).19
 XBB-dominant phase1.06 (.91–1.24).43
Age1.004 (1.001–1.006).005
Male sexc.78 (.73–.84)<.001
Pandemic hired1.07 (.99–1.15).08
Clinical jobe1.11 (1.05–1.18)<.001
Time since proximate SARS-CoV-2 exposuref
 91–180 d1.70 (1.45–1.99)<.001
 181–270 d1.88 (1.63–2.16)<.001
 271–365 d2.81 (2.45–3.21)<.001
 >365 d2.15 (1.86–2.50)<.001

Open in a separate window

Abbreviations: CI, confidence interval; HR, hazard ratio; SARS-CoV-2, severe acute respiratory syndrome coronavirus 2.

aThe number of prior vaccine doses was not included as a variable because its inclusion would have introduced significant multicollinearity into the model.

bTime-dependent covariate.

cReference: female sex.

dReference: prepandemic hire.

eReference: nonclinical job.

fReference: ≤90 days; this includes those previously vaccinated within 90 days but not those previously infected within 90 days, as the latter would not have qualified for inclusion until 90 days after their most recent infection.

Go to:

DISCUSSION

This study found that the current bivalent vaccines were about 29% effective overall in protecting against infection with SARS-CoV-2 when the Omicron BA.4/5 lineages were the predominant circulating strains, and effectiveness was lower when the circulating strains were no longer represented in the vaccine. A protective effect could not be demonstrated when the XBB lineages were dominant. The magnitude of protection afforded by bivalent vaccination while the BA.4/5 lineages were dominant was similar to that estimated in another study using data from the Increasing Community Access to Testing national SARS-CoV-2 testing program [16].

The strengths of our study include its large sample size and its conduct in a healthcare system where very early recognition of the critical importance of maintaining an effective workforce during the pandemic led to devotion of resources to provide an accurate accounting of who had COVID-19, when COVID-19 was diagnosed, who received a COVID-19 vaccine, and when. The study method, treating bivalent vaccination as a time-dependent covariate, allowed vaccine effectiveness to be determined in real time.

The study has several limitations. Individuals with unrecognized prior infection would have been misclassified as previously uninfected. Since prior infection protects against subsequent infection, such misclassification would have resulted in underestimating the protective effect of the vaccine. However, there is little reason to suppose that prior infections would have been missing in the bivalent-vaccinated and nonvaccinated states at disproportionate rates. There might be concern that those who chose to receive the bivalent vaccine may have been more worried about infection and more likely to be tested when they had symptoms, thereby disproportionately detecting more incident infections among those who received the bivalent vaccine. We did not find an association between the number of COVID-19 tests done and the number of prior vaccine doses, however, suggesting that this was not a confounding factor. Those who chose to get the bivalent vaccine could have been those who were more likely to have lower risk-taking behavior with respect to COVID-19. This would have the effect of finding a higher risk of COVID-19 in the nonvaccinated state, thereby potentially overestimating vaccine effectiveness, because the lower risk of COVID-19 in the bivalent-vaccinated state could have been due to lower risk-taking behavior rather than the vaccine.

The widespread availability of home testing kits might have reduced detection of incident infections. This potential effect should be somewhat mitigated in our healthcare cohort because one needs a NAAT to get paid time off, providing a strong incentive to get a NAAT if one tests positive at home. Even if one assumes that some individuals chose not to follow up on a positive home test result with a NAAT, it is very unlikely that individuals would have chosen to pursue NAAT after receiving the bivalent vaccine more than before receiving it, at rates disproportionate enough to affect the study’s findings.

We were unable to distinguish between symptomatic and asymptomatic infections and had to limit our analyses to all detected infections. Variables that were not considered might have influenced the findings substantially. Time since last prior exposure to SARS-CoV-2 could not be included in the primary model owing to multicollinearity. It is possible that the association of number of prior vaccine doses with increased risk of infection may have been confounded by time since last prior exposure to SARS-CoV-2. There were too few severe illnesses for the study to determine whether the vaccine decreased severity of illness. Finally, our study was done in a healthcare population, and included no children and few elderly persons, and the majority of study participants would not have been immunocompromised.

A possible explanation for a lower-than-expected vaccine effectiveness is that a substantial proportion of the population may have had prior asymptomatic Omicron variant infection. About a third of SARS-CoV-2 infections have been estimated to be asymptomatic in studies performed in different places at different times [17–19]. If so, protection from the bivalent vaccine may have been masked because those with prior Omicron variant infection may have already been somewhat protected against COVID-19 by virtue of natural immunity. A seroprevalence study conducted by the CDC found that by February 2022, 64% of the 18–64-year age-group population and 75% of children and adolescents had serologic evidence of prior SARS-CoV-2 infection [20], with almost half of the positive serologic results attributed to infections occurring between December 2021 and February 2022, which would have predominantly been Omicron BA.1/BA.2-lineage infections. With such a large proportion of the population expected to have already been previously exposed to the Omicron variant of SARS-CoV-2, it is possible that a substantial proportion of individuals may be unlikely to derive any meaningful benefit from a bivalent vaccine.

The association of increased risk of COVID-19 with more prior vaccine doses was unexpected. A simplistic explanation might be that those who received more doses were more likely to be individuals at higher risk of COVID-19. A small proportion of individuals may have fit this description. However, the majority of participants in this study were young, and all were eligible to have received ≥3 doses of vaccine by the study start date, which they had every opportunity to do. Therefore, those who received ❤ doses (46% of individuals in the study) were not ineligible to receive the vaccine but rather chose not to follow the CDC’s recommendations on remaining updated with COVID-19 vaccination, and one could reasonably expect these individuals to have been more likely to exhibit risk-taking behavior. Despite this, their risk of acquiring COVID-19 was lower than that that of participants those who received more prior vaccine doses.

Ours is not the only study to find a possible association with more prior vaccine doses and higher risk of COVID-19. During an Omicron wave in Iceland, individuals who had previously received ≥2 doses were found to have a higher odds of reinfection than those who had received <2 doses, in an unadjusted analysis [21]. A large study found, in an adjusted analysis, that those who had an Omicron variant infection after previously receiving 3 doses of vaccine had a higher risk of reinfection than those who had an Omicron variant infection after previously receiving 2 doses [22]. Another study found, in multivariable analysis, that receipt of 2 or 3 doses of am mRNA vaccine following prior COVID-19 was associated with a higher risk of reinfection than receipt of a single dose [7]. Immune imprinting from prior exposure to different antigens in a prior vaccine [22, 23] and class switch toward noninflammatory spike-specific immunoglobulin G4 antibodies after repeated SARS-CoV-2 mRNA vaccination [24] have been suggested as possible mechanisms whereby prior vaccine may provide less protection than expected. We still have a lot to learn about protection from COVID-19 vaccination, and in addition to vaccine effectiveness, it is important to examine whether multiple vaccine doses given over time may not be having the beneficial effect that is generally assumed.

In conclusion, this study found an overall modest protective effect of the bivalent vaccine against COVID-19 while the circulating strains were represented in the vaccine and lower protection when the circulating strains were no longer represented. A significant protective effect was not found when the XBB lineages were dominant. The unexpected finding of increasing risk with increasing number of prior COVID-19 vaccine doses needs further study.

Go to:

Acknowledgments

Author contributions. N. K. S.: Conceptualization, methodology, validation, investigation, data curation, software, formal analysis, visualization, writing (original draft preparation; reviewing and editing), supervision, and project administration. P. C. B.: Resources, investigation, validation, and writing (reviewing and editing). A. S. N.: Methodology, formal analysis, visualization, validation, and writing (reviewing and editing). J. F. S. and A. H.: Resources and writing (reviewing and editing). S. M. G.: Project administration, resources, and writing (reviewing and editing).

Go to:

Contributor Information

Nabin K Shrestha, Department of Infectious Diseases, Cleveland Clinic, Cleveland, Ohio, USA.

Patrick C Burke, Infection Prevention, Cleveland Clinic, Cleveland, Ohio, USA.

Amy S Nowacki, Quantitative Health Sciences, Cleveland Clinic, Cleveland, Ohio, USA.

James F Simon, Enterprise Business Intelligence, Cleveland Clinic, Cleveland, Ohio, USA.

Amanda Hagen, Occupational Health, Cleveland Clinic, Cleveland, Ohio, USA.

Steven M Gordon, Department of Infectious Diseases, Cleveland Clinic, Cleveland, Ohio, USA.

Go to:

References

1. Polack FP, Thomas SJ, Kitchin N, et al.. Safety and efficacy of the BNT162b2 mRNA COVID-19 vaccine. N Engl J Med 2020; 383:2603–15. [PMC free article] [PubMed] [Google Scholar]

2. Baden LR, El Sahly HM, Essink B, et al.. Efficacy and safety of the mRNA-1273 SARS-CoV-2 vaccine. N Engl J Med 2021; 384:403–16. [PMC free article] [PubMed] [Google Scholar]

3. Dagan N, Barda N, Kepten E, et al.. BNT162b2 mRNA COVID-19 vaccine in a nationwide mass vaccination setting. N Engl J Med 2021; 384:1412–23. [PMC free article] [PubMed] [Google Scholar]

4. Haas EJ, Angulo FJ, McLaughlin JM, et al.. Impact and effectiveness of mRNA BNT162b2 vaccine against SARS-CoV-2 infections and COVID-19 cases, hospitalisations, and deaths following a nationwide vaccination campaign in Israel: an observational study using national surveillance data. Lancet 2021; 397:1819–29. [PMC free article] [PubMed] [Google Scholar]

5. Shrestha NK, Nowacki AS, Burke PC, Terpeluk P, Gordon SM. Effectiveness of mRNA COVID-19 vaccines among employees in an American healthcare system. medRxiv [Preprint: not peer reviewed]. 10 August2021. Available from: https://www.medrxiv.org/content/10.1101/2021.06.02.21258231v1.

6. Shrestha NK, Burke PC, Nowacki AS, Terpeluk P, Gordon SM. Necessity of coronavirus disease 2019 (COVID-19) vaccination in persons who have already had COVID-19. Clin Infect Dis 2022; 75:e662–71. [PMC free article] [PubMed] [Google Scholar]

7. Shrestha NK, Shrestha P, Burke PC, Nowacki AS, Terpeluk P, Gordon SM. Coronavirus disease 2019 vaccine boosting in previously infected or vaccinated individuals (COVID-19). Clin Infect Dis 2022; 75:2169–77. [PMC free article] [PubMed] [Google Scholar]

8. Andeweg SP, de Gier B, Eggink D, et al.. Protection of COVID-19 vaccination and previous infection against Omicron BA.1, BA.2 and Delta SARS-CoV-2 infections. Nat Commun 2022; 13:4738. [PMC free article] [PubMed] [Google Scholar]

9. Altarawneh HN, Chemaitelly H, Hasan MR, et al.. Protection against the Omicron variant from previous SARS-CoV-2 infection. N Engl J Med 2022; 386:1288–90. [PMC free article] [PubMed] [Google Scholar]

10. Malato J, Ribeiro RM, Fernandes E, et al.. Rapid waning of protection induced by prior BA.1/BA.2 infection against BA.5 infection. medRxiv [Preprint: not peer reviewed]. 15 November2022. Available from: https://www.medrxiv.org/content/10.1101/2022.08.16.22278820v1.

11. Lambrou AS., Shirk P, Steele MK, et al.. Genomic surveillance for SARS-CoV-2 variants: predominance of the delta (B.1.617.2) and Omicron (B.1.1.529) variants—United States, June 2021–January 2022. MMWR Morb Mortal Wkly Rep 2022; 71:206–11. [PMC free article] [PubMed] [Google Scholar]

12. Simon R, Makuch RW. A non-parametric graphical representation of the relationship between survival and the occurrence of an event: application to responder versus non-responder bias. Stat Med 1984; 3:35–44. [PubMed] [Google Scholar]

13. Therneau TM, Crowson C, Atkinson E. Using time dependent covariates and time dependent coefficients in the Cox model. 2021. Available at: https://cran.r-project.org/web/packages/survival/vignettes/timedep.pdf. Accessed 8 May 2021.

14. Therneau TM, Grambsh PM. Modeling survival data: extending the Cox model. New York,NY: Springer International Publishing, 2000. [Google Scholar]

15. R Core Team . R: a language and environment for statistical computing. 2022.

16. Link-Gelles R, Ciesla AA, Fleming-Dutra KE, et al.. Effectiveness of bivalent mRNA vaccines in preventing symptomatic SARS-CoV-2 infection—increasing community access to testing program, United States, September–November 2022. MMWR Morb Mortal Wkly Rep 2022; 71:1526–30. [PMC free article] [PubMed] [Google Scholar]

17. Oran DP, Topol EJ. The proportion of SARS-CoV-2 infections that are asymptomatic : a systematic review. Ann Intern Med 2021; 174:655–62. [PMC free article] [PubMed] [Google Scholar]

18. McDonald SA, Miura F, Vos ERA, et al.. Estimating the asymptomatic proportion of SARS-CoV-2 infection in the general population: analysis of nationwide serosurvey data in the Netherlands. Eur J Epidemiol 2021; 36:735–9. [PMC free article] [PubMed] [Google Scholar]

19. Shang W, Kang L, Cao G, et al.. Percentage of asymptomatic infections among SARS-CoV-2 Omicron variant-positive individuals: a systematic review and meta-analysis. Vaccines (Basel) 2022; 10:1049. [PMC free article] [PubMed] [Google Scholar]

20. Clarke KEN, Jones JM, Deng Y, et al.. Seroprevalence of infection-induced SARS-CoV-2 antibodies—United States, September 2021–February 2022. MMWR Morb Mortal Wkly Rep 2022; 71:606–8. [PMC free article] [PubMed] [Google Scholar]

21. Eythorsson E, Runolfsdottir HL, Ingvarsson RF, Sigurdsson MI, Palsson R. Rate of SARS-CoV-2 reinfection during an Omicron wave in Iceland. JAMA Netw Open 2022; 5:e2225320. [PMC free article] [PubMed] [Google Scholar]

22. Chemaitelly H, Ayoub HH, Tang P, et al.. . COVID-19 primary series and booster vaccination and immune imprinting. medRxiv [Preprint: not peer reviewed]. 13 November 2022. Available from: https://www.medrxiv.org/content/10.1101/2022.10.31.22281756v1.

23. Cao Y, Jian F, Wang J, et al.. Imprinted SARS-CoV-2 humoral immunity induces convergent Omicron RBD evolution. Nature 2023; 614:521–9. [PMC free article] [PubMed] [Google Scholar]

24. Irrgang P, Gerling J, Kocher K, et al.. Class switch toward noninflammatory, spike-specific IgG4 antibodies after repeated SARS-CoV-2 mRNA vaccination. Sci Immunol 2023; 8:eade2798. [PMC free article] [PubMed] [Google Scholar]

Real-world COVID-19 vaccine effectiveness against the Omicron BA.2 variant in a SARS-CoV-2 infection-naive population

Nature Medicine volume 29, pages 348–357 (2023)Cite this article

Abstract

The SARS-CoV-2 Omicron variant has demonstrated enhanced transmissibility and escape of vaccine-derived immunity. Although first-generation vaccines remain effective against severe disease and death, robust evidence on vaccine effectiveness (VE) against all Omicron infections, irrespective of symptoms, remains sparse. We used a community-wide serosurvey with 5,310 subjects to estimate how vaccination histories modulated risk of infection in infection-naive Hong Kong during a large wave of Omicron BA.2 epidemic in January–July 2022. We estimated that Omicron infected 45% (41–48%) of the local population. Three and four doses of BNT162b2 or CoronaVac were effective against Omicron infection 7 days after vaccination (VE of 48% (95% credible interval 34–64%) and 69% (46–98%) for three and four doses of BNT162b2, respectively; VE of 30% (1–66%) and 56% (6–97%) for three and four doses of CoronaVac, respectively). At 100 days after immunization, VE waned to 26% (7–41%) and 35% (10–71%) for three and four doses of BNT162b2, and to 6% (0–29%) and 11% (0–54%) for three and four doses of CoronaVac. The rapid waning of VE against infection conferred by first-generation vaccines and an increasingly complex viral evolutionary landscape highlight the necessity for rapidly deploying updated vaccines followed by vigilant monitoring of VE.

Main

During 1 January to 31 July 2022, Hong Kong experienced an unprecedented fifth wave of COVID-19 infections driven predominantly by the Omicron BA.2 variant (B.1.1.529.2) with 1,341,363 reported cases (18.4% of the total population) and 9,290 deaths (0.7%)1. The fifth wave dwarfed the previous four waves in terms of cumulative infection attack rate (IAR), which was nearly zero before 2022 given Hong Kong’s then-successful ‘dynamic Zero-Covid’ strategy. Thus, population immunity to SARS-CoV-2 was almost entirely vaccine-derived when the fifth wave began. The messenger RNA vaccine Comirnaty (BNT162b2 mRNA, BioNTech/Fosun-Pharma) and the inactivated CoronaVac vaccine (Sinovac Life Sciences) have been available free of charge to Hong Kong residents aged 18 and above from 26 February 2021. Since then, eligibility to receive BNT162b2 or CoronaVac had been gradually extended to adolescents and children aged 6 months or above, and boosters to adolescents aged 12 years or above. Population uptake of at least two doses of either vaccine increased from 4.7 million (64% of the total population) by 1 January 2022 to 6.5 million (89%) by 31 July 2022 (ref. 1).

We conducted a community-wide serosurvey to estimate: (1) age-specific IAR in the fifth wave; (2) age-specific population immunity in the fifth wave; and (3) VE against SARS-CoV-2 infection conferred by two, three and four homologous doses of BNT162b2 or CoronaVac for 100 days after each dose. Specifically, for each subject in our serosurvey, we estimated the probability of being infected by SARS-CoV-2 before study recruitment, given age, vaccination record and seropositivity of the serum sample (Methods). Correspondingly, we defined VE as the reduction in the probability of being infected by SARS-CoV-2 within the observation period, as conferred by the type and doses of vaccine received by the subject, relative to the probability of infection for an unvaccinated subject in the same period. Our estimates of VE and waning were specific to infection by Omicron BA.2 only because almost all COVID-19 infections in Hong Kong before our study period were BA.2. We assumed that: (1) daily age-specific force of infection (FOI) was proportional to daily viral load from city-wide wastewater surveillance (Fig. 1 and Extended Data Fig. 1), which has been shown to be a robust (normalized) proxy for disease prevalence over time2,3,4; and (2) one-dose vaccination provided no protection against infection and each successive homologous dose conferred greater VE that decayed exponentially over time at the same rate between doses of the same vaccine5.

figure 1
Fig. 1: Daily COVID-19 confirmed cases, SARS-CoV-2 wastewater viral load, weekly proportion of SARS-CoV-2 lineages, population vaccination coverage, sera collection history and study subject vaccination history.

Results

Our serosurvey subjects included: (1) 5,173 healthy adult blood donors recruited from the Hong Kong Red Cross Blood Transfusion Service between 28 April and 30 July 2022; and (2) 137 children aged 18 months to 11 years randomly recruited from the community to participate in an independent polio seroepidemiology study (see Fig. 1d for sera collection history). Vaccination histories were available for 5,242 subjects (Fig. 1 and Table 1) from the Hong Kong Department of Health (98%) or self-report (2%). At the time of sample collection, 1,237 blood donors (24%) and 31 child subjects (23%) self-reported a previous infection.Table 1 Characteristics of study participants, April 2022 to July 2022 (n = 5,310), excluding 67 participants with non-BNT162b2 or non-CoronaVac, or undetermined, vaccination history and one participant with undetermined age

Full size table

We developed two in-house enzyme-linked immunosorbent assays (ELISA) detecting immunoglobulin (Ig)G antibodies to the C-terminal domain of the nucleocapsid (N) protein (N-CTD) and the Open Reading Frame 8 protein (ORF8) of SARS-CoV-2, respectively, modifying and validating previously reported methods6,7. We estimated that our N-CTD assay was more than 95% sensitive and 96% specific in detecting recent Omicron infection among unvaccinated individuals and homologous BNT162b2 vaccinees. Because the inactivated whole-virus vaccine CoronaVac elicits antibody to the N protein, the ORF8 assay was optimized specifically for discriminating between infection and vaccine-derived antibody in CoronaVac vaccinees. We estimated that our ORF8 assay was 81% sensitive and 93% specific in detecting recent Omicron infection among homologous CoronaVac vaccinees. See Extended Data Fig. 2 for a mapping of vaccination cohort by assay. See Methods, Fig. 2 and Extended Data Fig. 3 for further details on assay workflow, performance and output. To our knowledge, our ORF8 assay is the first serological test that could effectively detect and discriminate recent SARS-CoV-2 infection from vaccination among CoronaVac vaccinees.

figure 2
Fig. 2: SARS-CoV-2 N-CTD and ORF8 antibody responses among study subjects by vaccination history, age and self-reported infection history.

Assuming VE took full effect 7 days after vaccination, we estimated: (1) VE for the second, third or fourth doses of BNT162b2 were 13% (95% credible interval: 2–39%), 48% (34–64%) and 69% (46–98%) 7 days following immunization, respectively, waning to 7% (1–21%), 26% (7–41%) and 35% (10–71%) 100 days after immunization; and (2) VE for the second, third or fourth dose of the CoronaVac vaccine were 5% (0–27%), 30% (1–66%) and 56% (6–97%) 7 days following immunization, respectively, waning to 1% (0–11%), 6% (0–29%) and 11% (0–54%) 100 days after immunization.

Studies conducted during Omicron BA.1/BA.2 dominance and involving three adult doses8, four adult doses9 or two adolescent (12–17 years old) doses10 of BNT162b2 vaccination indicated full build-up of VE between 7–21 days (adults) and 14–27 days (adolescents) after the last dose. No data on VE build-up over time was available for CoronaVac, although serum neutralizing antibody titers peaked at around 2–3 weeks after homologous CoronaVac vaccination11. We selected a 7-day delay as our base case because the likelihood value in the inference decreased with longer delay. Nonetheless, we carried out sensitivity analyses assuming VE took effect 14 or 21 days after immunization, which yielded similar VE and waning estimates over time (Fig. 3). Because of the slow rise in cases from late June to the end of July, contemporaneous with the emergence of the BA.4/BA.5 variants (Fig. 1a,b), we performed further sensitivity analyses including only specimens collected by 15 June 2022, which also yielded similar results (Extended Data Fig. 4).

figure 3
Fig. 3: Estimated VE.

We then estimated age-specific IARs and population immunity over time, together with ascertainment ratios from polymerase chain reaction with reverse transcription (RT–PCR) testing and rapid antigen testing (RAT) using the approach detailed in the Methods. In brief, we first proxied the city-wide FOI via viral load data from wastewater surveillance, adjusted for age effect and calibrated against seropositivity among our unvaccinated study subjects. We then applied our estimates of VE and waning to the (anonymized) vaccination records for every individual in the population provided by the Hong Kong government to derive the probability of infection for each individual until 31 July 2022. Age-specific IARs were then derived by aggregating these probabilities and segmenting into age groups (Figs. 4, 5a and 6). Via this approach, we estimated that SARS-CoV-2 (predominantly Omicron BA.2) infected 45% (41–48%) of the population between 1 January and 31 July 2022. Adolescents and young adults had slightly higher IARs than other age groups. Assuming VE took effect after a 14- or 21-day delay yielded similar IAR estimates. Overall ascertainment ratio was 25% (23–27%) from RT–PCR testing alone, increasing to 41% (38–45%) if augmented with RAT (Fig. 4).

figure 4
Fig. 4: Estimated IAR, population immunity and ascertainment ratio.
figure 5
Fig. 5: IAR and population immunity over time.
figure 6
Fig. 6: IAR over time by age group.

Meanwhile, we defined population immunity as the fraction of the population protected against Omicron BA.2 infection owing to previous infection or vaccination12,13, which was equivalent to the relative reduction in the effective reproduction number Rt conferred by natural and vaccine-induced immunity at any given time t. Protection conferred by vaccination was assessed based on our estimates of VE and waning. For each individual, we also calculated their probability of infection. We assumed that vaccination-induced and naturally acquired immunity were independent14, and that natural infection (with or without previous vaccination) provided perfect protection against reinfection (at least in the short term until the end of our study on 31 July 2022). That is, we did not model the differential protection against reinfection after natural infection between unvaccinated and vaccinated individuals (‘hybrid’ immunity was not modeled).

We estimated population immunity reached 52% (45–57%) by 31 July 2022. Sensitivity analyses assuming exponentially decaying immunity from natural infection yielded population immunity of 48% (42–54%) or 36% (31–41%) if such naturally acquired immunity decayed to 85% in 365 days15 or to 75% in 100 days16,17, respectively (Fig. 5 and Extended Data Figs. 57). The former estimate of decay was used in medium-term modeling in the UK. The latter, swifter, estimate of decay reflected the emergence and immune escape of the Omicron BA.4/BA.5 variants approximately 3 months after BA.1/BA.2 peaked in Portugal and Qatar—a time frame similar to that experienced in Hong Kong by late July 2022.

Discussion

Estimating VE against Omicron infection has been challenging in populations that have experienced widespread infection by older variants, owing to difficulties in disentangling the protective effect of vaccine-derived immunity from that of immunity derived from previous infection and ‘hybrid’ immunity. Although the test-negative design has been increasingly used to estimate VE against COVID-19, the robustness of the resulting estimates are typically conditional on symptoms and susceptible to confounding and selection bias (for example, owing to differential healthcare-seeking behavior)18. Furthermore, most VE estimates hitherto have estimated protection against symptomatic disease, hospitalization or death but not against all infections including asymptomatic infections. Our estimates of VE against Omicron BA.2 infection are robust against the abovementioned limitations because Hong Kong had negligible infection-derived immunity against any SARS-CoV-2 before to January 2022, and the infection histories of our subjects were individually inferred based on their serological measurements (irrespective of history of symptoms, case confirmation or contact)19.

Our Omicron IAR estimates over time were lower than those reported in South Africa (58% in urban areas by April 2022)20, Denmark (66% by March 2022)21, Navarre, Spain (up to 59% by May 2022)22 and British Columbia, Canada (up to 61% by July–August 2022)23 likely reflecting the effectiveness of extensive public health and social measures imposed in Hong Kong during the fifth wave, such as a universal mask mandate with high community compliance, closure of all bars, and limits on opening hours and new ventilation requirements in all restaurants24, counteracted by the very high density of Hong Kong’s residential dwellings facilitating rapid aerosol transmission between apartments25.

Our estimates provide evidence of the short-term effectiveness against Omicron infection of a third or fourth dose of either the mRNA or inactivated vaccine. Slightly higher initial BNT162b2 VE followed by rapid waning has been reported in the literature for symptomatic or RT–PCR-confirmed Omicron BA.2 infection. For example, Chemaitelly et al. reported that effectiveness relative to an unvaccinated reference group against symptomatic infection after the second dose was 51.7% in the first 3 months and waned to ≤10% thereafter, increasing to 43.7% after a booster dose before waning again at similar rate8. Meanwhile, Gazit et al. reported a fourth dose of BNT162b2 was 65.1% more effective by the third week against RT–PCR-confirmed Omicron infection relative to a third dose among people aged 60 years or older, declining to 22.0% by the end of 10 weeks9, although lower effectiveness was reported in Magen et al.26 and Regev-Yochay et al.27 also using triple-vaccinated subjects as reference groups. An update to Regev-Yochay et al. reported that the fourth dose of BNT162b2 no longer conferred a statistically significant incremental benefit above the third dose 103–180 days after vaccination28, similar to our estimate of VE for BNT162b2 after 100 days.

By contrast, there are very limited data on CoronaVac VE against Omicron infection29. Our study provides the first estimate of real-world VE and waning against Omicron infection conferred by three or four doses of CoronaVac. A recent telephone survey in Hong Kong reported three doses of COVID-19 vaccination with either BNT162b2 or CoronaVac provided 52% protection against test-positivity by RT–PCR or RAT relative to unvaccinated individuals, but was unable to account for time since vaccination or for asymptomatic infection30. Two South American studies reported 38.2 and 39.8% VE from two doses of CoronaVac against symptomatic Omicron infection in children aged 3–5 and 6–11 years, respectively,29,31 also relative to unvaccinated individuals. As a caveat, we distinguish our definition of VE (the reduction in the probability of infection relative to that of an unvaccinated reference group, with infection detected by seropositivity) from the definitions used in the above studies (generally, the reduction in the incidence of infection among a vaccinated and/or boosted intervention arm relative to a reference arm of unvaccinated or less-vaccinated individuals, with infection detected by voluntary RT–PCR or RAT testing). The different definitions might have contributed to the differences between our VE estimates and those of the other studies cited above.

We previously reported markedly reduced serum neutralizing antibody titers against BA.2 among individuals recently vaccinated with three doses of CoronaVac compared with the wild-type virus, with antibody titers below the predicted protective threshold32. Thus, our estimate of VE against BA.2 infection elicited by three doses of CoronaVac appears greater than would be expected from neutralizing antibody titers. Indeed, a recent VE study of CoronaVac vaccine using a test-negative design during this same BA.2 epidemic in Hong Kong also observed robust protection from severe disease and death33. It is possible that neutralizing antibody titers underestimate protection conferred by whole-virus inactivated vaccines such as CoronaVac, which present multiple viral proteins to the host immune system that may protect via multiple pathways other than neutralizing antibodies, such as T cell immunity and antibody-dependent cytotoxicity6.

Nonetheless, we note that the rapid waning of VE over time from even four doses of intramuscular vaccination by monovalent mRNA or inactivated vaccines based on the original Wuhan strain demonstrates the limits of such vaccines in preventing SARS-CoV-2 infection and transmission in the long run. Further, although boosting by BNT162b2 or CoronaVac restores strong protection against hospitalization and death33,34,35, the incremental effectiveness of BNT162b2 boosters against such outcomes waned over the course of 4–6 months34 for both adults and the elderly36. There are limited data on CoronaVac waning in the Omicron era, though VE against intensive care admission in Malaysia waned considerably among the elderly 3–5 months after the primary series during a period of Delta dominance37. If this finding is confirmed in other studies, surge booster vaccination to top-up protection against severe disease and death, particularly among the elderly, remains a key tool in reducing COVID-19’s burden on healthcare systems and mortality before anticipated waves of infections.

Since September 2022, bivalent mRNA vaccines encoding the BA.5 spike protein have become widely available. Early observational evidence on their real-world VE are emerging38. Further investigations are necessary to ascertain the VE and waning over time in the midst of our complex SARS-CoV-2 variant and immunity landscape.

Despite the potential of reformulated bivalent boosters in increasing population immunity before upcoming waves of infections, vaccine hesitancy has resulted in very slow uptake of the bivalent boosters since their introduction39. The quadruple threat of potentially rapid VE waning, poor vaccine uptake, the possibility for immune imprinting and increasing complex SARS-CoV-2 evolution with the potential for multiple antigenically distant lineages cocirculating simultaneously40 may also create formidable challenges in the formulation and rapid deployment of updated bivalent or multivalent vaccines in the near future. There is thus substantial impetus to accelerate the development of mucosal vaccines41 and/or universal sarbecovirus vaccines42 capable of inducing broad, durable immunity against different variants of SARS-CoV-2 (refs. 43,44) to break the chain of transmission and limit the absolute burden of severe disease and long-term sequelae (long covid)45 from high-levels of breakthrough COVID-19 infection.

Limitations

Our study has several important limitations. First, we assumed that the effect of vaccination history on contact patterns and mobility (that is, exposure to the virus), a potential confounder of VE estimates, was negligible. Second, we had no serum samples from individuals aged 12–17 years and only few samples from individuals aged >65 years. As such, our IAR estimates for these age groups were less robust compared with other age groups. We assumed the same IAR among those aged >65 because: (1) 18, 16 and 17% of those aged 60–69, 70–79 and >80 years were confirmed to have COVID-19 during the period 1 January to 31 July 2022 (ref. 1); and (2) testing was widely available during the fifth wave and hence the ascertainment ratio was likely to be similar among those aged >65 years. Given the dramatically higher incidence of severe disease and death among the elderly, booster vaccination schemes should continue to prioritize this age cohort, particularly in lower- and middle-income countries with limited vaccine supply.

Third, we were unable to provide estimates of VE against hospitalization, severe disease and death owing to the wide introduction of oral antivirals in both ambulatory and hospital settings on 26 February 2022 in Hong Kong. The antivirals were very effective in further reducing the risk of hospitalization and death among those aged >60 years, including those who were partially vaccinated46,47 or, in the case of Nirmatrelvir/Ritonavir (Paxlovid), also those who were fully vaccinated and boosted and had received their most recent dose >20 weeks previously48. Any estimate of VE against such outcomes, regardless of study methodology, must therefore account for the use of oral antivirals among its study subjects. Because we did not have access to comprehensive population-level data on oral antiviral usage in Hong Kong (particularly those prescribed in outpatient settings) or complete data matching cases of severe disease and death against their vaccination history and use of oral antivirals, we were unable to derive accurate estimates of VE, which must account for the significant protective effect of oral antivirals.

Fourth, our analysis was primarily based on seroprevalence among blood donors and voluntary child participants recruited from the community in the polio seroepidemiology study who might be healthier and thus not be representative of the general population in terms of their infection history, potentially underestimating seroprevalence. Nonetheless, nations that have relied on blood donors to provide early estimates of seroprevalence have subsequently reported similar estimates among random population samples49 or commercial laboratory specimen remnants50. In Hong Kong, a separate study of 873 hospital patient plasma specimens detected 43% were anti-N seropositive and 23% were anti-ORF8 seropositive by May 2022 (ref. 51). Another separate phylogenetic model of population IAR using GISAID sequences uploaded from multiple laboratories in Hong Kong as input also arrived at upper estimates between 33 and 49% (13–100%) by the week of 16 April 2022, which was similar to our mean estimate of 40% in the same week52. These independent estimates provide confidence that our reliance on healthy blood donors and voluntary child participants did not result in a material underestimate of COVID-19 seroprevalence in the general population.

Fifth, the small number of CoronaVac vaccinees in our serosurvey together with the short duration of the fifth wave led to substantial uncertainty in our CoronaVac VE estimates.

Sixth, we were unable to estimate VE conferred by heterologous vaccinations (CoronaVac with BNT162b2 boosters or vice versa) because of the very small number of individuals with such vaccination history (heterologous boosters were not available in Hong Kong until late 2021). When estimating IAR, we assumed that VE for each dose in heterogenous vaccinees equals that of the corresponding dose in homologous vaccinees.

Seventh, because our positive controls comprise only confirmed or self-reported infections, the corresponding seropositivity threshold may not be sufficiently sensitive to detect individuals with asymptomatic or very mild infections, thereby underestimating IAR. Two large pre-Omicron seroepidemiological studies before the availability of vaccines have reported that 5% (ref. 53) or 20% (ref. 54) of confirmed cases may not seroconvert. We performed sensitivity analyses to estimate the increase in our IAR estimates assuming that 10% or 25% of infected individuals did not seroconvert (that is, corresponding to seroconversion rates of 90 and 75%) (Extended Data Fig. 8). A 90% seroconversion rate would increase our IAR estimate to 50% (46–52%), whereas a 75% seroconversion rate would increase our estimate to 59% (54–63%) by 31 July 2022.

Lastly, because most of our serum samples were collected during and after a period of BA.2 dominance, we were unable to estimate further accelerated VE waning due to the emergence of later variants such as BA.4/BA.5 by late July 2022 in Hong Kong.

In conclusion, our results indicate the short-term effectiveness of booster vaccination using either the mRNA or inactivated vaccine in preventing SARS-CoV-2 Omicron BA.2 infection. As such, surge booster campaigns could be strategically used to rapidly boost population immunity before upcoming waves of infections. The comparatively lower IAR in Hong Kong also highlights the effect of supplementing vaccination campaigns with continued public health and social measures in disease transmission. Nonetheless, in light of the potential for waning of VE, antigenic imprinting and rapid viral evolution, frequently updated studies quantifying the protective effect of repeated booster vaccination, including with the new bivalent COVID-19 vaccines, are necessary for policymakers to develop effective booster vaccination strategies.

Methods

Data sources

Serosurveys conducted by the study team

As part of a community-based COVID-19 seroepidemiological study, we recruited healthy blood donors by convenience sampling at the five largest blood donation centers (Mongkok, Causeway Bay, Kwun Tong, Tsuen Wan and Shatin) of the Hong Kong Red Cross Blood Transfusion Service from 28 April to 30 July 2022. We also tested serum samples from participants in an independent polio seroepidemiology study targeting children aged 18 months to 10 years from 7 May to 5 August 2022. Child participants in the polio seroepidemiology study were recruited at random from the community via social media, website and word-of-mouth advertising. Blood donors were matched by the Hong Kong Red Cross Blood Transfusion Service and the Hong Kong Department of Health with official vaccination records via unique blood transfusion service donor identification numbers. The records were then anonymized and provided to the study team. Both blood donors and child participants were asked to self-report their vaccination and COVID-19 infection history (as confirmed by RT–PCR testing or RAT pursuant to Hong Kong government guidelines). In cases in which official vaccination records were unavailable (that is, those vaccinated outside Hong Kong), we relied on the donors’ self-reported vaccination history if provided. All child participants self-reported their vaccination and infection history.

Written informed consent was obtained from all participants. Parental consent was obtained for all participants aged <18 years. Further, consent was obtained from the parents of child participants of the polio seroepidemiology survey to test collected sera for antibodies and/or biomarkers specific to a panel of pathogens other than polio, including but not limited to SARS-CoV-2, seasonal influenza, respiratory syncytial virus, human metapneumovirus, adenovirus, rhinovirus, enterovirus and human parainfluenza virus. Blood donor participants received no compensation for their participation. Child participants received compensation of HK $1,000 for participating in the polio seroepidemiology study. Ethical approval for this study and the polio seroepidemiology study (including the use of samples collected therein for antibody or biomarker testing against nonpolio pathogens) were obtained from the Institutional Review Board of the Hospital Authority Hong Kong West Cluster/University of Hong Kong (IRB No. UW 20–132 and IRB No. UW 21–196, respectively).

Vaccination records, confirmed cases and sewage surveillance data provided by the Hong Kong government

Official vaccination records in Hong Kong are maintained by the Hong Kong Department of Health55. Anonymous data on every vaccination up to 31 July 2022, including the date of each dose, type of vaccine (BNT162b2 or CoronaVac) used and vaccinee year-of-birth, were compiled by the Department of Health and provided to us by the Hong Kong Office of the Government Chief Information Officer. Age data on all confirmed SARS-CoV-2 cases were provided by the Centre for Health Protection. Daily per capita 2-day running geometric mean SARS-CoV-2 viral load data (in copies of SARS-CoV-2 RNA l−1) obtained from city-wide COVID-19 wastewater surveillance up to 31 July 2022 were provided by the Hong Kong Environmental Protection Department. The 2022 projected mid-year population in each age cohort was obtained from the Hong Kong Census and Statistics Department56.

Laboratory methods

We developed two in-house ELISA assays that detected IgG antibodies to N-CTD and ORF8 (ref. 57) of SARS-CoV-2, respectively, modifying the methodology reported in Mok et al.6 and Hachim et al7. The ORF8 assay was developed specifically for detecting past Omicron BA.2 infections in CoronaVac vaccinees because most of them were N-CTD-seropositive owing to the immune response that CoronaVac elicits against the N protein. The ELISA assays as previously described6,7 were optimized and validated. In brief, 96-well ELISA plates (Nunc MaxiSorp, Thermo Fisher Scientific) were coated overnight with 40 ng well−1 of purified recombinant N-CTD protein in PBS buffer for the N-CTD protein ELISA assay or 30 ng well−1 of purified recombinant ORF8 protein in PBS buffer for the ORF8 ELISA assay. The plates were then blocked by 100 μl of Chonblock blocking buffer (Chondrex) per well and incubated at room temperature for 2 h. Each serum sample was tested at a dilution of 1:100 in Chonblock blocking buffer in duplicate. The serum dilutions were added and incubated for 2 h at 37 °C. After extensive washing with PBS containing 0.2% Tween 20, horseradish peroxidase-conjugated goat anti-human IgG (1:5,000; GE Healthcare) was added and incubated for 1 h at 37 °C. The ELISA plates were then washed again with PBS containing 0.2% Tween 20. Subsequently, 100 μl of horseradish peroxidase substrate (Ncm TMB One; New Cell and Molecular Biotech) was added into each well. After 15 min incubation, the reaction was stopped by adding 50 μl of 2 M H2SO4 solution and analyzed on a microplate reader at 450 nm wavelength. Positive and negative controls were included in each run.

This resulted in cutoffs of 0.2583 and 0.33 optical density (OD) for N-CTD and ORF8, respectively. The assays and cutoffs were validated against pre-pandemic blood donor samples, blood samples from homologous BNT162b2- or CoronaVac-vaccinated individuals collected during periods of minimal community transmission in 2020 and 2021, blood samples collected from RT–PCR-confirmed SARS-CoV-2 convalescent individuals in 2020 and 2021, and samples from blood donors in the current study with self-reported infection history. See Extended Data Fig. 3 for details on control groups and assay performance (sensitivity, specificity and receiver operating curves). We set the ELISA cutoffs to approximately maximize the sum of sensitivity and specificity, which were in turn estimated via bootstrapping 2,000 samples using the pROC R package58, with specificity set not lower than 90%.

We did not account for waning of N-CTD and ORF8 antibody response. Nonetheless, we previously reported that N- and ORF8-specific antibody responses were well maintained for at least 100 days postinfection7. This is on par with the time elapsed between infection (for example, the fifth wave peaked in early March 2022) and the time of sample collection (between late April and July 2022) for our serosurvey subjects.

Statistical methods

Statistical inference of VE

Let VEv,j(u) be the VE of vaccine type v (B for BNT162b2 and C for CoronaVac) against infection u days after the jth dose in a homologous series has taken effect. For each vaccine type v, we assumed: (1) the first dose provided no protection against infection, that is VEv,1(u)=0 (ref. 59); (2) VEv,j(0) depended on the number but not the time of previous doses; (3) VE waned exponentially at a constant rate λv after each dose5,60,61,62, that is VEv,j(u)=VEv,j(0)×exp(−λvu); and (4) VEv,j(0) increased with each successive dose in a homologous series, that is VEv,j+1(0)>VEv,j(0) (refs. 26,63,64,65). We also assumed that the initial VE of two-dose BNT162b2 was not inferior to that of two-dose CoronaVac, that is VEB,2(0)≥VEC,2(0)

(the latter was not statistically identifiable otherwise).

Let time 0 be 1 January 2021. We assumed that the FOI at time t was proportional to the viral load per capita from city-wide sewage. Specifically, given an individual aged a with vaccination history H who remained uninfected at time t, her FOI at that time was

λ(t)=γ×f(a)×VL(t)×VEv,n(t)(tTn(t))

where:

  1. (1) f(a) was the effect of age on FOI with f(35) = 1 (those aged 35 years were the reference group). We assumed that: (1) f(a) was a piecewise cubic Hermite interpolating polynomial function for 10 ≤ a ≤ 65 with knots at 10, 18, 35, 50 and 65 years; and (2) f(a) = f(10) for a < 10 and f(a) = f(65) for a > 65.
  2. (2) VL(t) was the two-day running geometric mean viral load per capita from city-wide sewage.
  3. (3) n(t) was the total number of doses of vaccine type v that the individual had received up to time t and Tn(t) was the time at which the most recent dose took effect.
  4. (4) γ was a scaling factor (subject to statistical inference; Supplementary Table 1).

The probability that this individual was infected between time 0 and t was pinfection(t|a,H)=1−exp(−∫t0λ(u)du)

. If tested at the time t, this individual would be seropositive with probability

pseropositive(t|a,H)=qsens,v×pinfection(t|a,H)+(1−qspec,v)×(1−pinfection(t|a,H))

where qsens,v and qspec,v

were the sensitivity and specificity of the serological assay that we used to infer previous Omicron infections for individuals vaccinated with vaccine type v.

Let θ denote the set of model parameters subject to statistical inference (Supplementary Table 1). Let D denote the data available for inferring θ which comprised:

  1. (1) The age, vaccination history and time of serum collection of each subject i in the serosurvey. These data were used to calculate the probability of seropositivity of the serum sample collected from subject i (pseropositive,i

) via the abovementioned model. (2)

The observed seropositivity of the serum sample for each subject i in the serosurvey (τi = 1 if seropositive and τi = 0 otherwise). (3)

The number of positive and negative controls for estimating the sensitivity and specificity of our in-house ELISA assays among individuals with different vaccination history (nsens,v and nspec,v) and the respective number of seropositive samples (ysens,v and yspec,v

  1. ). See Extended Data Fig. 3 for details.

We used the following likelihood function to infer θ from D:

L(θ|D)=∏i∈SerosurveyBernoulli(τi|pseropositive,i)×∏v∈{U,B,C}Binomial(ysens,v|nsens,v,qsens,v)×∏v∈{U,B,C}Binomial(yspec,v|nspec,v,1−qspec,v)

where Bernoulli(⋅|p) was the Bernoulli pdf with parameter p, Binomial(⋅|n,q)

was the Binomial pdf with n trials and success probability q. The statistical inference was performed in a Bayesian framework with noninformative (flat) priors using Markov Chain Monte Carlo with Gibbs sampling. We used P(θ) to denote the posterior distribution of θ obtained from fitting the model to the data D.

Estimating IAR and population immunity

We randomly drew 300 samples of θ from P(θ). For each sample of θ drawn, we calculated pinfection,i(t) (cumulative probability of infection) and REi(t)+(1−pinfection,i(t))×VEv,j(t)

(expected immunity) for each individual in the general population given their vaccination record (as done for our serosurvey subjects) on days t at weekly intervals between 1 January and 31 July 2022. The protection conferred by previous infection against reinfection on day t is:

REi(t)=∫t0p′infection,i(τ)×exp(−κ(tτ))dτ

where:

  1. (1) p′infection,i(τ)=λ(τ)exp(−∫τ0λ(u)du)
  1. is the probability of getting infected at time τ
  2. (2) κ is the waning rate of immunity conferred by previous infection.

Three κ scenarios were considered: (1) κ = 0 (base case, no waning); (2) κ=−log(0.85)/365 (corresponding to the ‘high waning’ scenario of 15% in one year in Barnard et al.15); and (3) κ=−log(0.75)/100

(corresponding to a 25% loss of protection within 100 days as observed in Portugal16 and Qatar17 upon BA.4/BA.5 emergence).

Posterior medians and 95% credible intervals of age-specific IARs and population immunity were compiled accordingly.

For individuals with heterologous CoronaVac and BNT162b2 vaccinations, we assumed VE for each dose was the same as that of the corresponding type and dose in a homologous series. We substituted missing records for intervening or preceding doses with the vaccine type of the next recorded dose, with a 90-day gap between the third and fourth doses, 180-day gap between the second and third doses or a 14-day gap between the first and second doses as per Hong Kong government recommendations before 31 May 2022. We derived the number of unvaccinated individuals in each age cohort based on the 2022 predicted mid-year population per the Census and Statistics Department56.

Lastly, we calculated the median and 95% confidence intervals of IARs, population immunity and ascertainment ratios by age group. We further performed sensitivity analyses incorporating the posterior distribution corresponding to 2-week (14 days) or a 3-week (21 days) delay for VE to take effect after each dose (Figs. 36 and Extended Data Figs. 57).

All analyses were performed using MATLAB 2022a with the Parallel Computing and Econometrics toolboxes and R v.4.2.1, with the tidyverse (v.1.3.2), pROC (v.1.18.0), cowplot (v.1.1.1) and janitor (v.2.1.0) packages.

Reporting summary

Further information on research design is available in the Nature Portfolio Reporting Summary linked to this article.

Data availability

The anonymized vaccination record data were compiled by the Office of the Government Chief Information Officer (OGCIO) (enquiry@ogcio.gov.hk) and the Department of Health (enquiries@dh.gov.hk), The Government of Hong Kong Special Administrative Region (HKSAR). Age data for confirmed cases were compiled by the Centre for Health Protection (enquiries@dh.gov.hk). Data on viral load from sewage surveillance were compiled by the Environmental Protection Department, The Government of HKSAR (enquiry@epd.gov.hk). The aforementioned data could not be shared due to confidentiality undertakings to the above-named agencies. Interested parties could contact these agencies for access to these data. Request for access to anonymized serology output data may be directed to the corresponding author. However, as this data is matched to vaccination records covered by the aforementioned confidentiality undertaking, access is also subject to preapproval by the above-named agencies of The Government of HKSAR. Outputs of our analysis and source data for Figs. 36 and Extended Data Figs. 1 and 48 are accessible at https://github.com/jonathanjlau-hku/hkserosurvey2022.

Code availability

All code files are accessible at https://github.com/jonathanjlau-hku/hkserosurvey2022.

References

  1. Statistics on 5th Wave of COVID-19 (from 31 Dec 2021 up till 31 Jul 2022 00:00) (The Government of the Hong Kong Special Administrative Region, 2022); https://www.coronavirus.gov.hk/pdf/5th_wave_statistics/5th_wave_statistics_20220731.pdf
  2. Modelling the Fifth Wave of COVID-19 in Hong Kong – Update #9 (The Univ. of Hong Kong, 2022); https://www.med.hku.hk/en/news/press//-/media/HKU-Med-Fac/News/slides/20220314-sims_wave_5_omicron_2022_03_14_final.ashx
  3. Morvan, M. et al. An analysis of 45 large-scale wastewater sites in England to estimate SARS-CoV-2 community prevalence. Nat. Commun. 13, 4313 (2022).PDF opens in a new tabArticle  CAS  PubMed  PubMed Central  Google Scholar 
  4. Amman, F. et al. Viral variant-resolved wastewater surveillance of SARS-CoV-2 at national scale. Nat. Biotechnol. 40, 1814–1822 (2022).PDF opens in a new tabArticle  CAS  PubMed  Google Scholar 
  5. Khoury, D. S. et al. Neutralizing antibody levels are highly predictive of immune protection from symptomatic SARS-CoV-2 infection. Nat. Med. 27, 1205–1211 (2021).PDF opens in a new tabArticle  CAS  PubMed  Google Scholar 
  6. Mok, C. K. P. et al. Comparison of the immunogenicity of BNT162b2 and CoronaVac COVID-19 vaccines in Hong Kong. Respirology 27, 301–310 (2022).PDF opens in a new tabArticle  PubMed  Google Scholar 
  7. Hachim, A. et al. SARS-CoV-2 accessory proteins reveal distinct serological signatures in children. Nat. Commun. 13, 2951 (2022).PDF opens in a new tabArticle  CAS  PubMed  PubMed Central  Google Scholar 
  8. Chemaitelly, H. et al. Duration of mRNA vaccine protection against SARS-CoV-2 Omicron BA.1 and BA.2 subvariants in Qatar. Nat. Commun. 13, 3082 (2022).PDF opens in a new tabArticle  CAS  PubMed  PubMed Central  Google Scholar 
  9. Gazit, S. et al. Short term, relative effectiveness of four doses versus three doses of BNT162b2 vaccine in people aged 60 years and older in Israel: retrospective, test negative, case-control study. BMJ 377, e071113 (2022).Article  PubMed  Google Scholar 
  10. Florentino, P. T. V. et al. Vaccine effectiveness of two-dose BNT162b2 against symptomatic and severe COVID-19 among adolescents in Brazil and Scotland over time: a test-negative case-control study. Lancet Infect. Dis. 22, 1577–1586 (2022).Article  CAS  PubMed  PubMed Central  Google Scholar 
  11. Li, X. et al. Long-term variations and potency of neutralizing antibodies against Omicron subvariants after CoronaVac-inactivated booster: a 7-month follow-up study. J. Med. Virol. 95, e28279 (2022).PubMed  PubMed Central  Google Scholar 
  12. Moghadas, S. M., Sah, P., Shoukat, A., Meyers, L. A. & Galvani, A. P. Population immunity against COVID-19 in the United States. Ann. Intern. Med. 174, 1586–1591 (2021).Article  PubMed  Google Scholar 
  13. Klaassen, F. et al. Population immunity to pre-Omicron and Omicron SARS-CoV-2 variants in US states and counties through December 1, 2021. Clin. Infect. Dis. 20, ciac438 (2022). Google Scholar 
  14. Sonabend, R. et al. Non-pharmaceutical interventions, vaccination, and the SARS-CoV-2 delta variant in England: a mathematical modelling study. Lancet 398, 1825–1835 (2021).Article  CAS  PubMed  PubMed Central  Google Scholar 
  15. Barnard, R. C., Davies, N. G., Jit, M. & Edmunds, W. J. Modelling the medium-term dynamics of SARS-CoV-2 transmission in England in the Omicron era. Nat. Commun. 13, 4879 (2022).PDF opens in a new tabArticle  CAS  PubMed  PubMed Central  Google Scholar 
  16. Malato, J. et al. Risk of BA.5 infection among persons exposed to previous SARS-CoV-2 variants. N. Engl. J. Med. 387, 953–954 (2022).Article  PubMed  Google Scholar 
  17. Altarawneh, H. N. et al. Effects of previous infection and vaccination on symptomatic omicron infections. N. Engl. J. Med. 387, 21–34 (2022).Article  CAS  PubMed  Google Scholar 
  18. Sullivan, S. G., Tchetgen Tchetgen, E. J. & Cowling, B. J. Theoretical basis of the test-negative study design for assessment of influenza vaccine effectiveness. Am. J. Epidemiol. 184, 345–353 (2016).PDF opens in a new tabArticle  PubMed  PubMed Central  Google Scholar 
  19. Chen, L. L. et al. Contribution of low population immunity to the severe Omicron BA.2 outbreak in Hong Kong. Nat. Commun. 13, 3618 (2022).PDF opens in a new tabArticle  CAS  PubMed  PubMed Central  Google Scholar 
  20. Sun, K. et al. Rapidly shifting immunologic landscape and severity of SARS-CoV-2 in the Omicron era in South Africa. Nat. Commun. 14, 246 (2023).PDF opens in a new tabArticle  CAS  PubMed  PubMed Central  Google Scholar 
  21. Erikstrup, C. et al. Seroprevalence and infection fatality rate of the SARS-CoV-2 Omicron variant in Denmark: a nationwide serosurveillance study. Lancet Reg. Health Eur. 21, 100479 (2022).Article  PubMed  PubMed Central  Google Scholar 
  22. Castilla, J. et al. Seroprevalence of antibodies against SARS-CoV-2 and risk of COVID-19 in Navarre, Spain, May to July 2022. Eur. Surveill. 27, 2200619 (2022).Article  Google Scholar 
  23. Skowronski, D. M. et al. Serial cross-sectional estimation of vaccine-and infection-induced SARS-CoV-2 seroprevalence in British Columbia, Canada. CMAJ 194, E1599–E1609 (2022).Article  PubMed  PubMed Central  Google Scholar 
  24. Cheng, V. C.-C. et al. Outbreak investigation of airborne transmission of Omicron (B.1.1.529) – SARS-CoV-2 variant of concern in a restaurant: implication for enhancement of indoor air dilution. J. Hazard. Mater. 430, 128504 (2022).Article  CAS  PubMed  PubMed Central  Google Scholar 
  25. Cheng, V. C. et al. Explosive outbreak of SARS-CoV-2 Omicron variant is associated with vertical transmission in high-rise residential buildings in Hong Kong. Build. Environ. 221, 109323 (2022).Article  PubMed  PubMed Central  Google Scholar 
  26. Magen, O. et al. Fourth dose of BNT162b2 mRNA Covid-19 vaccine in a nationwide setting. N. Engl. J. Med. 386, 1603–1614 (2022).Article  CAS  PubMed  Google Scholar 
  27. Regev-Yochay, G. et al. Efficacy of a fourth dose of Covid-19 mRNA vaccine against omicron. N. Engl. J. Med. 386, 1377–1380 (2022).Article  PubMed  Google Scholar 
  28. Canetti, M. et al. Six-month follow-up after a fourth BNT162b2 vaccine dose. N. Engl. J. Med. 387, 2092–2094 (2022).Article  PubMed  Google Scholar 
  29. Florentino, P. T. V. et al. Vaccine effectiveness of CoronaVac against COVID-19 among children in Brazil during the Omicron period. Nat. Commun. 13, 4756 (2022).PDF opens in a new tabArticle  CAS  PubMed  PubMed Central  Google Scholar 
  30. Yang, B. et al. Effectiveness of CoronaVac and BNT162b2 vaccine against SARS-CoV-2 Omicron BA.2 infections in Hong Kong. J. Infect. Dis. 226, 1382–1384 (2022).PDF opens in a new tabArticle  PubMed  Google Scholar 
  31. Jara, A. et al. Effectiveness of CoronaVac in children 3–5 years of age during the SARS-CoV-2 Omicron outbreak in Chile. Nat. Med. 28, 1377–1380 (2022).PDF opens in a new tabArticle  CAS  PubMed  PubMed Central  Google Scholar 
  32. Cheng, S. M. et al. SARS-CoV-2 Omicron variant BA.2 neutralisation in sera of people with Comirnaty or CoronaVac vaccination, infection or breakthrough infection, Hong Kong, 2020 to 2022. Eur. Surveill. 27, 2200178 (2022).Article  CAS  Google Scholar 
  33. McMenamin, M. E. et al. Vaccine effectiveness of one, two, and three doses of BNT162b2 and CoronaVac against COVID-19 in Hong Kong: a population-based observational study. Lancet Infect. Dis. 22, 1435–1443 (2022).Article  CAS  PubMed  PubMed Central  Google Scholar 
  34. Lin, D.-Y. et al. Association of primary and booster vaccination and prior infection with SARS-CoV-2 infection and severe COVID-19 outcomes. JAMA 328, 1415–1426 (2022).PDF opens in a new tabArticle  CAS  PubMed  Google Scholar 
  35. Ng, O. T. et al. Analysis of COVID-19 incidence and severity among adults vaccinated with 2-dose mRNA COVID-19 or inactivated SARS-CoV-2 vaccines with and without boosters in Singapore. JAMA Netw. Open 5, e2228900 (2022).PDF opens in a new tabArticle  PubMed  PubMed Central  Google Scholar 
  36. Ferdinands, J. M. et al. Waning of vaccine effectiveness against moderate and severe covid-19 among adults in the US from the VISION network: test negative, case-control study. BMJ 379, e072141 (2022).Article  PubMed  Google Scholar 
  37. Suah, J. L. et al. Waning COVID-19 vaccine effectiveness for BNT162b2 and CoronaVac in Malaysia: an observational study. Int. J. Infect. Dis. 119, 69–76 (2022).Article  CAS  PubMed  PubMed Central  Google Scholar 
  38. Link-Gelles, R. et al. Effectiveness of bivalent mRNA vaccines in preventing symptomatic SARS-CoV-2 infection—Increasing Community Access to Testing Program, United States, September–November 2022. MMWR Morb. Mortal. Wkly Rep. 71, 1526–1530 (2022).Article  PubMed  PubMed Central  Google Scholar 
  39. Trends in Number of COVID-19 Vaccinations in the US (Centers for Disease Control and Prevention, 2022); https://covid.cdc.gov/covid-data-tracker/#vaccination-trends
  40. Roemer, C. et al. SARS-CoV-2 Evolution, Post-Omicron (Virological.org, 2022); https://virological.org/t/sars-cov-2-evolution-post-omicron/911
  41. Topol, E. J. & Iwasaki, A. Operation Nasal Vaccine-Lightning speed to counter COVID-19. Sci. Immunol. 7, eadd9947 (2022).Article  CAS  PubMed  Google Scholar 
  42. The Lancet Infectious Diseases. Why hybrid immunity is so triggering. Lancet Infect. Dis. 22, 1649 (2022).Article  CAS  PubMed  PubMed Central  Google Scholar 
  43. Dolgin, E. Pan-coronavirus vaccine pipeline takes form. Nat. Rev. Drug Discov. 21, 324–326 (2022).PDF opens in a new tabArticle  CAS  PubMed  Google Scholar 
  44. Looi, M. K. & Mahase, E. What next for covid-19 vaccines? BMJ 379, o2422 (2022).Article  PubMed  Google Scholar 
  45. Al-Aly, Z., Bowe, B. & Xie, Y. Long COVID after breakthrough SARS-CoV-2 infection. Nat. Med. 28, 1461–1467 (2022).PDF opens in a new tabArticle  CAS  PubMed  PubMed Central  Google Scholar 
  46. Wong, C. K. H. et al. Real-world effectiveness of early molnupiravir or nirmatrelvir–ritonavir in hospitalised patients with COVID-19 without supplemental oxygen requirement on admission during Hong Kong’s omicron BA.2 wave: a retrospective cohort study. Lancet Infect. Dis. 22, 1681–1693 (2022).Article  CAS  PubMed  PubMed Central  Google Scholar 
  47. Wong, C. K. H. et al. Real-world effectiveness of molnupiravir and nirmatrelvir plus ritonavir against mortality, hospitalisation, and in-hospital outcomes among community-dwelling, ambulatory patients with confirmed SARS-CoV-2 infection during the omicron wave in Hong Kong: an observational study. Lancet 400, 1213–1222 (2022).Article  CAS  PubMed  PubMed Central  Google Scholar 
  48. Dryden-Peterson, S. et al. Nirmatrelvir plus ritonavir for early COVID-19 in a large U.S. health system: a population-based cohort study. Ann. Intern. Med. 176, 77–84 (2022).Article  PubMed  Google Scholar 
  49. Uyoga, S. et al. Seroprevalence of anti-SARS-CoV-2 IgG antibodies in Kenyan blood donors. Science 371, 79–82 (2021).Article  CAS  PubMed  Google Scholar 
  50. Jones, J. M. et al. Estimated US infection- and vaccine-induced SARS-CoV-2 seroprevalence based on blood donations, July 2020–May 2021. JAMA 326, 1400–1409 (2021).PDF opens in a new tabArticle  CAS  PubMed  Google Scholar 
  51. Poon, R. W. et al. SARS-CoV-2 IgG seropositivity after the severe Omicron wave of COVID-19 in Hong Kong. Emerg. Microbes Infect. 11, 2116–2119 (2022).Article  CAS  PubMed  PubMed Central  Google Scholar 
  52. Xie, R. et al. Resurgence of Omicron BA.2 in SARS-CoV-2 infection-naive Hong Kong. Preprint at Research Square https://doi.org/10.21203/rs.3.rs-2107395/v1 (2022).
  53. Oved, K. et al. Multi-center nationwide comparison of seven serology assays reveals a SARS-CoV-2 non-responding seronegative subpopulation. EClinicalMedicine 29, 100651 (2020).Article  PubMed  Google Scholar 
  54. Pathela, P. et al. Seroprevalence of severe acute respiratory syndrome coronavirus 2 following the largest initial epidemic wave in the United States: findings from New York City, 13 May to 21 July 2020. J. Infect. Dis. 224, 196–206 (2021).PDF opens in a new tabArticle  CAS  PubMed  Google Scholar 
  55. COVID-19 Vaccination Programme: About the Programme (The Government of the Hong Kong Special Administrative Region, 2022); https://www.covidvaccine.gov.hk/en/programme
  56. Mid-year Population for 2022, Table 1B: Population by Sex and Age (Census and Statistics Department, 2022); https://www.censtatd.gov.hk/en/web_table.html?id=1B
  57. Imamura, T., Isozumi, N., Higashimura, Y., Ohki, S. & Mori, M. Production of ORF8 protein from SARS-CoV-2 using an inducible virus-mediated expression system in suspension-cultured tobacco BY-2 cells. Plant Cell Rep. 40, 433–436 (2021).PDF opens in a new tabArticle  CAS  PubMed  PubMed Central  Google Scholar 
  58. Robin, X. et al. pROC: an open-source package for R and S+ to analyze and compare ROC curves. BMC Bioinformatics 12, 77 (2011).PDF opens in a new tabArticle  PubMed  PubMed Central  Google Scholar 
  59. Veneti, L. et al. Vaccine effectiveness with BNT162b2 (Comirnaty, Pfizer-BioNTech) vaccine against reported SARS-CoV-2 Delta and Omicron infection among adolescents, Norway, August 2021 to January 2022. Preprint at medRxiv https://doi.org/10.1101/2022.03.24.22272854 (2022).
  60. Kwok, S. L. et al. Waning antibody levels after COVID-19 vaccination with mRNA Comirnaty and inactivated CoronaVac vaccines in blood donors, Hong Kong, April 2020 to October 2021. Eur. Surveill. 27, 2101197 (2022).Article  CAS  Google Scholar 
  61. Cromer, D. et al. Neutralising antibody titres as predictors of protection against SARS-CoV-2 variants and the impact of boosting: a meta-analysis. Lancet Microbe 3, e52–e61 (2022).Article  CAS  PubMed  Google Scholar 
  62. McKeigue, P. M. et al. Vaccine efficacy against severe COVID-19 in relation to delta variant (B.1.617.2) and time since second dose in patients in Scotland (REACT-SCOT): a case-control study. Lancet Respir. Med. 10, 566–572 (2022).Article  CAS  PubMed  PubMed Central  Google Scholar 
  63. Abu-Raddad, L. J. et al. Effect of mRNA vaccine boosters against SARS-CoV-2 omicron infection in Qatar. N. Engl. J. Med. 386, 1804–1816 (2022).Article  CAS  PubMed  Google Scholar 
  64. Demonbreun, A. R. et al. Comparison of IgG and neutralizing antibody responses after one or two doses of COVID-19 mRNA vaccine in previously infected and uninfected individuals. EClinicalMedicine 38, 101018 (2021).Article  PubMed  PubMed Central  Google Scholar 
  65. Grewal, R. et al. Effectiveness of a fourth dose of covid-19 mRNA vaccine against the omicron variant among long term care residents in Ontario, Canada: test negative design study. BMJ 378, e071502 (2022).Article  PubMed  Google Scholar 

Download references

Acknowledgements

We thank the following agencies from The Government of Hong Kong Special Administrative Region for compiling the data used in this research: Office of the Government Chief Information Officer, Department of Health, Centre for Health Protection and the Environmental Protection Department (see Data Availability for details). The study was supported by the Health and Medical Research Fund—Commissioned Research on the Novel Coronavirus Disease (COVID-19) (reference no. COVID190126) from the Health Bureau, by AIR@InnoHK and C2i administered by Innovation and Technology Commission, both of the Government of the Hong Kong Special Administrative Region, and the Theme-based Research Grants Scheme (T11-712/19-N, SAV) of the Hong Kong Special Administrative Region. J.J.L. is supported by the University of Hong Kong Presidential PhD Scholarship. The authors thank J. Leung, C. Chu and C. Chan from the Hong Kong Red Cross Blood Transfusion Service, and T. Lam, D. Chan, H. Kock, S. Lam, M. Ngai, Z. Song, M. Wong and N. Wong from the School of Public Health, The University of Hong Kong, for research support.

Author information

Author notes

  1. These authors contributed equally: Jonathan J. Lau, Samuel M. S. Cheng.
  2. These authors jointly supervised this work: Malik Peiris, Joseph T. Wu.

Authors and Affiliations

  1. WHO Collaborating Centre for Infectious Disease Epidemiology and Control, School of Public Health, Li Ka Shing Faculty of Medicine, The University of Hong Kong, Hong Kong SAR, ChinaJonathan J. Lau, Kathy Leung, Tiffany H. K. Lo, Eric H. Y. Lau, Gabriel M. Leung & Joseph T. Wu
  2. Laboratory of Data Discovery for Health (D24H), Hong Kong SAR, ChinaJonathan J. Lau, Kathy Leung, Tiffany H. K. Lo, Eric H. Y. Lau, Gabriel M. Leung & Joseph T. Wu
  3. School of Public Health, Li Ka Shing Faculty of Medicine, The University of Hong Kong, Hong Kong SAR, ChinaJonathan J. Lau, Samuel M. S. Cheng, Kathy Leung, Leo C. H. Tsang, Kenny W. H. Yam, Sara Chaothai, Kelvin K. H. Kwan, Zacary Y. H. Chai, Tiffany H. K. Lo, Eric H. Y. Lau, Gabriel M. Leung, Malik Peiris & Joseph T. Wu
  4. The University of Hong Kong – Shenzhen Hospital, Shenzhen, ChinaKathy Leung & Joseph T. Wu
  5. Hong Kong Red Cross Blood Transfusion Service, Hong Kong SAR, People’s Republic of ChinaCheuk Kwong Lee
  6. HKU-Pasteur Research Pole, Li Ka Shing Faculty of Medicine, The University of Hong Kong, Hong Kong SAR, ChinaAsmaa Hachim & Sophie A. Valkenburg
  7. Research Institute for Bioresources and Biotechnology, Ishikawa Prefectural University, Nonoichi, JapanMasashi Mori
  8. Department of Pathology and Immunology, Washington University School of Medicine at St. Louis, St. Louis, MO, USAChao Wu & Gaya K. Amarasinghe
  9. Department of Microbiology and Immunology, Peter Doherty Institute for Infection and Immunity, University of Melbourne, Melbourne, Victoria, AustraliaSophie A. Valkenburg
  10. Department of Medicine and Therapeutics and Stanley Ho Centre for Emerging Infectious Diseases, Faculty of Medicine, Chinese University of Hong Kong, Hong Kong SAR, ChinaDavid S. C. Hui
  11. Centre for Immunology and Infection, Hong Kong SAR, ChinaMalik Peiris

Contributions

J.J.L., S.M.S.C., K.L., G.M.L., M.P. and J.T.W. contributed to conceptualization, data analysis and results interpretation. J.J.L., G.M.L., M.P. and J.T.W. contributed to manuscript writing. J.J.L., C.K.L., T.H.K.L., E.H.Y.L. and J.T.W. coordinated sample and data collection. D.S.C.H. contributed to clinical sample collection for assay validation. S.M.S.C. and M.P. coordinated all laboratory testing and laboratory data analysis. S.M.S.C., L.C.H.T., K.W.H.Y., S.C., K.K.H.K. and Z.Y.H.C. carried out all laboratory testing. A.H., M.M., C.W., S.A.V. and G.K.A. contributed to the development of the ORF8 ELISA assay.

Corresponding author

Correspondence to Joseph T. Wu.

Ethics declarations

Competing interests

A.H., M.P. and S.A.V. have filed an IDF (US 63/016,898) for the use of ORF8 and ORF3b as diagnostics of SARS-CoV-2 infection. M.M. produced ORF8 by patent process based on US Patents 8,507,220 and 8,586,826. The other authors declare no competing interests.

Peer review

Peer review information

Nature Medicine thanks the anonymous reviewers for their contribution to the peer review of this work. Primary Handling Editor: Saheli Sadanand, in collaboration with the Nature Medicine team.

Additional information

Publisher’s note Springer Nature remains neutral with regard to jurisdictional claims in published maps and institutional affiliations.

Extended data

Extended Data Fig. 1 The effect of age on force of infection (FOI) (that is f(a) in the model).

Individuals aged 35 years served as the reference group. The solid line indicates the posterior median, and the shaded regions indicate the 95% credible interval based on the fitted model, differentiated by assumption on delay to vaccine effectiveness taking effect.

Extended Data Fig. 2 Use of ELISA assay to discriminate infection from vaccine immunity by vaccination cohort.

This figure summarizes the in-house ELISA assays (green) we used to test for seropositivity amongst study subjects in different vaccination cohorts (orange). We did not test for seropositivity amongst heterologously vaccinated study subjects, study subjects who received vaccines other than BNT162b2 or CoronaVac, or study subjects with an un-determined vaccination history.

Extended Data Fig. 3 Description of controls, assay performance and Receiver Operating Curves (ROC) by ELISA assay type for detecting Omicron infection with in-house ELISA protocols.

(a) N-CTD ELISA amongst unvaccinated controls, tested against 48 unvaccinated study subjects with self-reported infection history, 142 unvaccinated RT-PCR positive convalescent samples ranging from 30 to 401 days after onset of illness and 526 pre-pandemic negative controls; (b) N-CTD ELISA amongst controls who were homologously vaccinated with BNT162b2, tested against 881 BNT-vaccinated study subjects with self-reported infection history, 1 BNT-vaccinated RT-PCR positive convalescent sample collected 369 days after onset of illness and 50 (tested twice) non-infected BNT-vaccinated samples collected during 2020–2021, a period of minimal community transmission; and (c) ORF8 ELISA amongst controls who were homologously vaccinated with CoronaVac, tested against 231 CoronaVac-vaccinated study subjects with self-reported infection history and 100 non-infected CoronaVac-vaccinated samples collected during 2020–2021, a period of minimal community transmission. Shaded areas indicate 95% confidence region. Red dot and cross represent the median sensitivity and specificity and corresponding confidence intervals of the OD threshold jointly estimated via Gibbs Sampling as described in Methods. Pos: positive controls, Neg: negative controls, Sens: sensitivity, Spec: specificity, AUC: area under the curve.

Extended Data Fig. 4 Vaccine effectiveness over time only including samples collected on or before 15 June 2022.

VE at zero to 200 days from receipt of last dose. VE is presented separately over time for two, three or four homologous doses of BNT162b2 (BNT) or CoronaVac. The lines indicate posterior medians and shaded bars indicate 95% credible intervals based on the fitted model.

Extended Data Fig. 5 Population immunity over time from vaccination and infection by age group assuming no waning of immunity from infection.

Population immunity estimates among those aged 12–19 or aged 60 or above were less accurate as no subjects were between 12 and 17 years old, and few were above 65 years old. The lines indicate posterior medians and shaded bars indicate 95% credible intervals based on the fitted model.

Extended Data Fig. 6 Population immunity over time from vaccination and infection by age group assuming immunity from infection wanes by 15% after 365 days.

Population immunity estimates among those aged 12–19 or aged 60 or above were less accurate as no subjects were between 12 and 17 years old, and few were above 65 years old. The lines indicate posterior medians and shaded bars indicate 95% credible intervals based on the fitted model.

Extended Data Fig. 7 Population immunity over time from vaccination and infection by age group assuming immunity from infection wanes by 25% after 100 days.

Population immunity estimates among those aged 12–19 or aged 60 or above were less accurate as no subjects were between 12 and 17 years old, and few were above 65 years old. The lines indicate posterior medians and shaded bars indicate 95% credible intervals based on the fitted model.

Extended Data Fig. 8 IAR over time by age group and assumptions on seroconversion rate among infected.

All figures assumed a 7-day delay to VE taking effect. IAR estimates among those aged 12–19 or aged 60 or above were less accurate as no subjects were between 12 and 17 years old, and few were above 65 years old. The lines indicate posterior medians and shaded bars indicate 95% credible intervals based on the fitted model.

Supplementary information

Supplementary Information

Supplementary Table 1: Parameters subject to statistical inference.

Reporting Summary

Rights and permissions

Open Access This article is licensed under a Creative Commons Attribution 4.0 International License, which permits use, sharing, adaptation, distribution and reproduction in any medium or format, as long as you give appropriate credit to the original author(s) and the source, provide a link to the Creative Commons license, and indicate if changes were made. The images or other third party material in this article are included in the article’s Creative Commons license, unless indicated otherwise in a credit line to the material. If material is not included in the article’s Creative Commons license and your intended use is not permitted by statutory regulation or exceeds the permitted use, you will need to obtain permission directly from the copyright holder. To view a copy of this license, visit http://creativecommons.org/licenses/by/4.0/.

Reprints and Permissions

About this article

Cite this article

Lau, J.J., Cheng, S.M.S., Leung, K. et al. Real-world COVID-19 vaccine effectiveness against the Omicron BA.2 variant in a SARS-CoV-2 infection-naive population. Nat Med 29, 348–357 (2023). https://doi.org/10.1038/s41591-023-02219-5

Download citation

  • Received21 October 2022
  • Accepted13 January 2023
  • Published18 January 2023
  • Issue DateFebruary 2023
  • DOIhttps://doi.org/10.1038/s41591-023-02219-5

Share this article

Anyone you share the following link with will be able to read this content:

Provided by the Springer Nature SharedIt content-sharing initiative

Subjects

This article is cited by

Download PDF

Advertisement

Nature Medicine (Nat Med) ISSN 1546-170X (online) ISSN 1078-8956 (print)

nature.com sitemap

About Nature Portfolio

Discover content

Publishing policies

Author & Researcher services

Libraries & institutions

Real-world COVID-19 vaccine effectiveness against the Omicron BA.2 variant in a SARS-CoV-2 infection-naive population

Nature Medicine volume 29, pages 348–357 (2023)Cite this article

Abstract

The SARS-CoV-2 Omicron variant has demonstrated enhanced transmissibility and escape of vaccine-derived immunity. Although first-generation vaccines remain effective against severe disease and death, robust evidence on vaccine effectiveness (VE) against all Omicron infections, irrespective of symptoms, remains sparse. We used a community-wide serosurvey with 5,310 subjects to estimate how vaccination histories modulated risk of infection in infection-naive Hong Kong during a large wave of Omicron BA.2 epidemic in January–July 2022. We estimated that Omicron infected 45% (41–48%) of the local population. Three and four doses of BNT162b2 or CoronaVac were effective against Omicron infection 7 days after vaccination (VE of 48% (95% credible interval 34–64%) and 69% (46–98%) for three and four doses of BNT162b2, respectively; VE of 30% (1–66%) and 56% (6–97%) for three and four doses of CoronaVac, respectively). At 100 days after immunization, VE waned to 26% (7–41%) and 35% (10–71%) for three and four doses of BNT162b2, and to 6% (0–29%) and 11% (0–54%) for three and four doses of CoronaVac. The rapid waning of VE against infection conferred by first-generation vaccines and an increasingly complex viral evolutionary landscape highlight the necessity for rapidly deploying updated vaccines followed by vigilant monitoring of VE.

SUMMARY FINDING OF TWO LARGE WELL DONE VACCINE EFFECTIVENESS STUDIES

  1. The risk of COVID-19 also increased with time since the most recent prior COVID-19 episode and with the number of vaccine doses previously received.
  2. At 100 days after immunization, VE waned to 26% (7–41%) and 35% (10–71%) for three and four doses of BNT162b2, and to 6% (0–29%) and 11% (0–54%) for three and four doses of CoronaVac.

The Group of 300 Who Rule the World. Fact or Conspiracy Theory of Dr. John Coleman, MI6. 2023-06-12. Jorma A Jyrkkanen, BSc, PDP

June 12, 2023

THE ALLEGATIONS ARE CITED BELOW. ONE CANNOT BUT SHOCKINGLY NOTICE AND COMPARE THE EVENTS SURROUNDING THE COVID ROLL OUT AND HOW MARVELOUSLY THEY FIT THE STATED OBJECTIVES OF ONE JACQUES ATTILLI A BILDERBERGER.

GLOBALISTS PLANS AN EARLY WARNING

MI6 EXPOSE ON G300. Dr John Coleman

Who Are They

PAST AND PRESENT MEMBERS OF THE COMMITTEE OF 300:

Abergavemy, Marquis of. Acheson, Dean. Adeane, Lord Michael. Agnelli, Giovanni. Alba, Duke of. Aldington, Lord. Aleman, Miguel. Allihone, Professor T. E. Alsop Family Designate. Amory, Houghton. Anderson, Charles A. Anderson, Robert 0. Andreas, Dwayne. Asquith, Lord. Astor, John Jacob and successor, Waldorf. Aurangzeb, Descendants of. Austin, Paul. Baco, Sir Ranulph BalFour, Arthur. Balogh, Lord. Bancroft, Baron Stormont. Baring. Barnato, B. Barran, Sir John. Baxendell, Sir Peter. Beatrice of Savoy, Princess. Beaverbrook, Lord. Beck, Robert. Beeley, Sir Harold. Beit, Alfred. Benn, Anthony Wedgewood. Bennet, John W. Benneton, Gilberto or alternate Carlo. Bertie, Andrew. Besant, Sir Walter. Bethal, Lord Nicholas. Bialkin, David. Biao, Keng. Bingham, William. Binny, J. F. Blunt, Wilfred. Bonacassi, Franco Orsini. Bottcher, Fritz. Bradshaw, Thornton. Brandt, Willy. Brewster, Kingman. Buchan, Alastair. Buffet, Warren. Bullitt, William C. Bulwer-Lytton, Edward. Bundy, McGeorge. Bundy, William. Bush, George. Cabot, John. Family Designate. Caccia, Baron Harold Anthony. Cadman, Sir John. Califano, Joseph. Carrington, Lord. Carter, Edward. Catlin, Donat. Catto, Lord. Cavendish, Victor C. W. Duke of Devonshire. Chamberlain, Houston Stewart. Chang, V. F. Chechirin, Georgi or Family Designate. Churchill, Winston. Cicireni, V. or Family Designate. Cini, Count Vittorio. Clark, Howard. Cleveland, Amory. Cleveland, Harland. Clifford, Clark. Cobold, Lord. Coffin, the Rev William Sloane. Constanti, House of Orange. Cooper, John. Family Designate. Coudenhove- Kalergi, Count. Cowdray, Lord. Cox, Sir Percy. Cromer, Lord Evelyn Baring. Crowther, Sir Eric. Cumming, Sir Mansfield. Curtis, Lionel. d’Arcy, William K. D’Avignon, Count Etienne. Danner, Jean Duroc. Davis, John W. de Benneditti, Carlo. De Bruyne, Dirk. De Gunzberg, Baron Alain. De Lamater, Major General Walter. De Menil, Jean. De Vries, Rimmer. de Zulueta, Sir Philip. de’Aremberg, Marquis Charles Louis. Delano. Family Designate. Dent, R. Deterding, Sir Henri. di Spadaforas, Count Guitierez, (House Douglas-Home, Sir Alec. Drake, Sir Eric. Duchene, Francois. DuPont. Edward, Duke of Kent. Eisenberg, Shaul. Elliott, Nicholas. Elliott, William Yandel. Elsworthy, Lord. Farmer, Victor. Forbes, John M. Foscaro, Pierre. France, Sir Arnold. Fraser, Sir Hugh. Frederik IX, King of Denmark Family Designate. Freres, Lazard. Frescobaldi, Lamberto. Fribourg, Michael. Gabor, Dennis. Gallatin, Albert. Family Designate. Gardner, Richard. Geddes, Sir Auckland. Geddes, Sir Reay. George, Lloyd. Giffen, James. Gilmer, John D. Giustiniani, Justin. Gladstone, Lord. Gloucestor, The Duke of. Gordon, Walter Lockhart. Grace, Peter J. Greenhill, Lord Dennis Arthur. Greenhill, Sir Dennis. Grey, Sir Edward. Gyllenhammar, Pierres. Haakon, King of Norway. Haig, Sir Douglas. Hailsham, Lord. Haldane, Richard Burdone. Halifax, Lord. Hall, Sir Peter Vickers. Hambro, Sir Jocelyn. Hamilton, Cyril. Harriman, Averill. Hart, Sir Robert. Hartman, Arthur H. Healey, Dennis. Helsby, Lord. Her Majesty Queen Elizabeth II. Her Majesty Queen Juliana. Her Royal Highness Princess Beatrix. Her Royal Highness Queen Margreta. Heseltine, Sir William. Hesse, Grand Duke descendants, Family Designate. Hoffman, Paul G. Holland, William. House of Braganza. House of Hohenzollern. House, Colonel Mandel. Howe, Sir Geoffrey. Hughes, Thomas H. Hugo, Thieman. Hutchins, Robert M. Huxley, Aldous. Inchcape, Lord. Jamieson, Ken. Japhet, Ernst Israel. Jay, John. Family Designate. Keynes, John Maynard. Jodry, J. J. Joseph, Sir Keith. Katz, Milton. Kaufman, Asher. Keith, Sir Kenneth. Keswick, Sir William Johnston, or Keswick, H.N.L. Keswick, William Johnston. Kimberly, Lord. King, Dr. Alexander. Kirk, Grayson L. Kissinger, Henry. Kitchener, Lord Horatio. Kohnstamm, Max. Korsch, Karl. Lambert, Baron Pierre. Lawrence, G. Lazar. Lehrman, Lewis. Lever, Sir Harold. Lewin, Dr. Kurt. Lippmann, Walter. Livingstone, Robert R. Family Designate. Lockhart, Bruce. Lockhart, Gordon. Linowitz, S. Loudon, Sir John. Luzzatto, Pieipaolo. Mackay, Lord, of Clasfern. Mackay- Tallack, Sir Hugh. Mackinder, Halford. MacMillan, Harold. Matheson, Jardine. Mazzini, Gueseppi. McClaughlin, W. E. McCloy, John J. McFadyean, Sir Andrew. McGhee, George. McMillan, Harold. Mellon, Andrew. Mellon, William Larimer or Family Designate. Meyer, Frank. Michener, Roland. Mikovan, Anastas. Milner, Lord Alfred. Mitterand, Francois. Monett, Jean. Montague, Samuel. Montefiore, Lord Sebag or Bishop Hugh. Morgan, John P. Mott, Stewart. Mountain, Sir Brian Edward. Mountain, Sir Dennis. Mountbatten, Lord Louis. Munthe, A., or family designate. Naisbitt, John. Neeman, Yuval. Newbigging, David. Nicols, Lord Nicholas of Bethal. Norman, Montague. O’Brien of Lotherby, Lord. Ogilvie, Angus. Okita, Saburo. Oldfield, Sir Morris. Oppenheimer, Sir Earnest, and successor, Harry. Ormsby Gore, David (Lord Harlech). Orsini, Franco Bonacassi. Ortolani. Umberto. Ostiguy, J.P.W. Paley, William S. Pallavacini. Palme, Olaf. Palmerston. Palmstierna, Jacob. Pao, Y.K. Pease, Richard T. Peccei, Aurellio. Peek, Sir Edmund. Pellegreno, Michael, Cardinal. Perkins, Nelson. Pestel, Eduard. Peterson, Rudolph. Petterson, Peter G. Petty, John R. Philip, Prince, Duke of Edinburgh. Piercy, George. Pinchott, Gifford. Pratt, Charles. Price Waterhouse, Designate. Radziwall. Ranier, Prince. Raskob, John Jacob. Recanati. Rees, John Rawlings. Rees, John. Rennie, Sir John. Rettinger, Joseph. Rhodes, Cecil John. Rockefeller, David. Role, Lord Eric of Ipsden. Rosenthal, Morton. Rostow, Eugene. Rothmere, Lord. Rothschild Elie de or Edmon de and/or Baron RothschiLd Runcie, Dr.Robert. Russell, Lord John. Russell, Sir Bertrand. Saint Gouers, Jean. Salisbury, Marquisse de Robert Gascoiugne Cecil. Shelburne, The Salisbury, Lord. Samuel, Sir Marcus. Sandberg, M. G. Sarnoff, Robert. Schmidheiny, Stephan or alternate brothers Thomas, Alexander. Schoenberg, Andrew. Schroeder. Schultz, George. Schwartzenburg, E. Shawcross, Sir Hartley. Sheridan, Walter. Shiloach, Rubin. Silitoe, Sir Percy. Simon, William. Sloan, Alfred P. Smuts, Jan. Spelman. Sproull, Robert. Stals, Dr. C. Stamp, Lord Family designate. Steel, David. Stiger, George. Strathmore, Lord. Strong, Sir Kenneth. Strong, Maurice. Sutherland. Swathling, Lord. Swire, J. K. Tasse, G. Or Family Designate. Temple, Sir R. Thompson, William Boyce. Thompson, Lord. Thyssen- Bornamisza, Baron Hans Henrich. Trevelyn, Lord Humphrey. Turner, Sir Mark. Turner, Ted. Tyron, Lord. Urquidi, Victor. Van Den Broek, H. Vanderbilt. Vance, Cyrus. Verity, William C. Vesty, Lord Amuel. Vickers, Sir Geoffrey. Villiers, Gerald Hyde family alternate. Volpi, Count. von Finck, Baron August. von Hapsburg, Archduke Otto, House of Hapsburg-Lorraine. Von Thurn and Taxis, Max. Wallenberg, Peter or Family Designate. Wang, Kwan Cheng, Dr. Warburg, S. C. Ward Jackson, Lady Barbara. Warner, Rawleigh. Warnke, Paul. Warren, Earl. Watson, Thomas. Webb, Sydney. Weill, David. Weill, Dr. Andrew. Weinberger, Sir Caspar. Weizman, Chaim. Wells, H. G. Wheetman, Pearson (Lord Cowdray). White, Sir Dick Goldsmith. Whitney, Straight. Wiseman, Sir William. Wittelsbach. Wolfson, Sir Isaac. Wood, Charles. Young, Owen. The Club of Rome, the Venetian Black Nobility, the Royal Institute for International Affairs (RIIA), the Council on Foreign Relations (CFR), the Bilderbergers, Trilaterals, the Zionists, Freemasonry, the Illuminati, the Order of St. John of Jerusalem. Read the Book.

WHAT DO THEY WANT?

RULERS OF OUR WORLD: The Committee of 300 is a small group of insidious people who control all aspects of our world. Through MI6 they ordered the murder of President Lincoln and President Kennedy. AIDS was created and WHO injected it into millions through the Smallpox vaccines. THEIR GOALS: (1) A One World Government with a unified church and monetary system under their direction. (2) The utter destruction of all national identity and national pride. (3) The destruction of religion and more especially the Christian religion, with the one exception, their own creation mentioned above. (4) Control of each and every person through means of mind control and nanotechnology which would create human-like robots and a system of terror. (5) An end to all industrialization and the production of nuclear generated electric power in what they call “the post-industrial zero-growth society.” (6) Legalization of drugs and pornography. (7) Depopulation of large cities. (8) Suppression of all scientific development except for those deemed beneficial by the Committee. Especially targeted is nuclear energy for peaceful purposes. (9) Cause by means of limited wars in the advanced countries, and by means of starvation and diseases in Third World countries, the death of 3 billion people by the year 2050, people they call “useless eaters.” (10) To weaken the moral fiber of the nation and to demoralize workers in the labor class by creating mass unemployment. (11) To keep people everywhere from deciding their own destinies by means of one created crisis after another and then “managing” such crises. (12) To introduce new cults. (13) To cause a total collapse of the world’s economies and engender total political chaos. (14) To take control of all Foreign and domestic policies of the United States. (15) Give full support to supranational institutions such as the United Nations (UN), the World Health Organization (WHO), the International Monetary Fund (IMF), the Bank of International Settlements (BIS) and the World Economic Forum(WEF) and the World Court. (16) Penetrate and subvert all governments, and work from within them to destroy the sovereign integrity of nations represented by them. (17) Organize a world-wide terrorist apparatus and negotiate with terrorists whenever terrorist activities take place. (18) Take control of education in America with the intent and purpose of utterly and completely destroying it.

DUTCH BANKER CLAIMS THEY ARE INVOLVED IN PEDOPHILIA AND CHILD TRAFFICKING AND MURDER

President Dwight D Eisenhower’s Farewell Speech Warning of the Power Grab Potential of a Unified Military Industrial Complex and the Threat it Poses to Democracy and the Constitution

Until the latest of our world conflicts, the United States had no armaments industry. American makers of plowshares could, with time and as required, make swords as well. But now we can no longer risk emergency improvisation of national defense; we have been compelled to create a permanent armaments industry of vast proportions. Added to this, three and a half million men and women are directly engaged in the defense establishment. We annually spend on military security more than the net income of all United State corporations.

This conjunction of an immense military establishment and a large arms industry is new in the American experience. The total influence-economic, political, even spiritual-is felt in every city, every state house, every office of the Federal government. We recognize the imperative need for this development. Yet we must not fail to comprehend its grave implications. Our toil, resources and livelihood are all involved; so is the very structure of our society.

In the councils of government, we must guard against the acquisition of unwarranted influence, whether sought or unsought, by the military-industrial complex. The potential for the disastrous rise of misplaced power exists and will persist.

We must never let the weight of this combination endanger our liberties or democratic processes. We should take nothing for granted only an alert and knowledgeable citizenry can compel the proper meshing of the huge industrial and military machinery of defense with our peaceful methods and goals, so that security and liberty may prosper together. [CIA+FBI+SPECIAL EXECUTIVE SERVICES+MIC+WEF+Bilderberg+need Constitutional Oversight in this regard]

Akin to, and largely responsible for the sweeping changes in our industrial-military posture, has been the technological revolution during recent decades.

In this revolution, research has become central; it also becomes more formalized, complex, and costly. A steadily increasing share is conducted for, by, or at the direction of, the Federal government.

Today, the solitary inventor, tinkering in his shop, has been over shadowed by task forces of scientists in laboratories and testing fields. In the same fashion, the free university, historically the fountainhead of free ideas and scientific discovery, has experienced a revolution in the conduct of research. Partly because of the huge costs involved, a government contract becomes virtually a substitute for intellectual curiosity. For every old blackboard there are now hundreds of new electronic computers.

The prospect of domination of the nation’s scholars by Federal employment, project allocations, and the power of money is ever present and is gravely to be regarded.

Yet, in holding scientific research and discovery in respect, as we should, we must also be alert to the equal and opposite danger that public policy could itself become the captive of a scientific-technological elite.

It is the task of statesmanship to mold, to balance, and to integrate these and other forces, new and old, within the principles of our democratic system-ever aiming toward the supreme goals of our free society.

******

Another factor in maintaining balance involves the element of time. As we peer into society’s future, we-you and I, and our government-must avoid the impulse to live only for today, plundering, for our own ease and convenience, the precious resources of tomorrow. We cannot mortgage the material assets of our grandchildren without risking the loss also of their political and spiritual heritage. We want democracy to survive for all generations to come, not to become the insolvent phantom of tomorrow.

******

Down the long lane of the history yet to be written America knows that this world of ours, ever growing smaller, must avoid becoming a community of dreadful fear and hate, and be, instead, a proud confederation of mutual trust and respect.

Such a confederation must be one of equals. The weakest must come to the conference table with the same confidence as do we, protected as we are by our moral, economic, and military strength. That table, though scarred by many past frustrations, cannot be abandoned for the certain agony of the battlefield.

Disarmament, with mutual honor and confidence, is a continuing imperative. Together we must learn how to compose difference, not with arms, but with intellect and decent purpose. Because this need is so sharp and apparent I confess that I lay down my official responsibilities in this field with a definite sense of disappointment. As one who has witnessed the horror and the lingering sadness of war-as one who knows that another war could utterly destroy this civilization which has been so slowly and painfully built over thousands of years-I wish I could say tonight that a lasting peace is in sight.

Happily, I can say that war has been avoided. Steady progress toward our ultimate goal has been made. But, so much remains to be done. As a private citizen, I shall never cease to do what little I can to help the world advance along that road.

DR.COLEMAN UK SS

THE COMMITTEE OF 300: The destruction and control of America and the World. The depopulation of millions of innocent people. The public execution of President John F. Kennedy. The control of U.S. Elections and elections around the world. The release of AIDS and deadly viruses. This is the work of the insidious Committee of 300. How long will America and humanity allow them to continue this rule of corruption, death and destruction? They will not give up their power. It must be forcibly removed from them. They are moving forward with the following agenda unless we stop them.

The Intent and Purpose of the Committee of 300 is to Bring to Pass the Following Conditions: A One World Government and one-unit monetary system under permanent non-elected hereditary Oligarch’s who self select from among their numbers in the form of a feudal system as it was in the Middle Ages. In this One World entity, population will be limited by restrictions on the number of children per family, diseases, wars, famines, until 1 billion people who are useful to the ruling class, in areas which will be strictly and clearly defined, remain as the total world population. There will be no middle class, only rulers and servants. All laws will be uniform under a legal system of world courts practicing the same unified code of laws, backed up by a One World Government police force and a One World unified military to enforce laws in all former countries where no national boundaries shall exist. The system will be on the basis of a welfare state; those who are obedient and subservient to the One World Government will be rewarded with the means to live; those who are rebellious will simply be starved to death or be declared outlaws, thus a target for anyone who wishes to kill them. Privately owned firearms or weapons of any kind will be prohibited. Only one religion will be allowed and that will be in the form of a One World Government Church, which has been in existence since 1920 as we shall see. Satanism, Luciferianism and Witchcraft shall he recognized as legitimate One World Government curricula with no private or church schools. All Christian churches have already been subverted and Christianity will be a thing of the past in the One World Government. To induce a state where there is no individual freedom or any concept of liberty surviving, there shall be no such thing as republicanism, sovereignty or rights residing with the people. National pride and racial identity shall be stamped out and in the transition phase it shall be subject to the severest penalties to even mention one’s racial origin. Each person shall be fully indoctrinated that he or she is a creature of the One World Government with an identification number clearly marked on their person so as to be readily accessible, which identifying number shall be in the master file of the NATO computer in Brussels, Belgium, subject to instant retrieval by any agency of the One World Government at any time. The master Files of the CIA, FBI, state and local police agencies, IRS, FEMA, Social Security shall be vastly expanded and form the basis of personal records of all individuals in the United States. Marriage shall be outlawed and there shall be no family life as we know it. Children will be removed from their parents at an early-age and brought up by wards as state property. Such an experiment was carried out in East Germany under Erich Honnecker when children were take away from parents considered by the state to be disloyal citizens. Women will be degraded through the continued process of “women’s liberation” movements. Free sex shall be mandatory. Failure to comply at least once by the age of 20 shall be punishable by severe reprisals against her person. Self-abortion shall be taught and practiced after two children are born to a woman; such records shall be contained in the personal file of each woman in the One World Government’s regional computers. If a woman falls pregnant after she has previously given birth to two children, she shall be forcibly removed to an abortion clinic for such an abortion and sterilization to be carried out. Pornography shall be promoted and be compulsory showing in every theater of cinema, including homosexual and lesbian pornography. The use of “recreational” drugs shall be compulsory, with each person allotted drug quotas which can be purchased at One World Government stores throughout the world. Mind control drugs will be expanded and usage become compulsory. Such mind control drugs shall be given in food and/or water supplies without the knowledge and/or consent of the people. Drug bars shall be set up, run by One World Government employees, where the slave-class shall be able to spend their free time. In this manner the non-elite masses will be reduced to the level and behavior of controlled animals with no will of their own and easily regimented and controlled. The economic system shall be based upon the ruling oligarchical class allowing just enough foods and services to be produced to keep the mass slave labor camps going. All wealth shall be aggregated in the hands of the elite members of the Committee of 300. Each individual shall be indoctrinated to understand that he or she is totally dependent upon the state for survival. The world shall be ruled by Committee of 300 Executive Decrees which become instant law. Courts of punishment and not courts of justice shall exist. Industry is to be totally destroyed along with nuclear powered energy systems. Only the Committee of 300 members and their elitists shall have the right to any of the earth’s resources. Agriculture shall be solely in the hands of the Committee of 300 with food production strictly controlled. As these measures begin to take effect, large populations in the cities shall be forcibly removed to remote areas and those who refuse to go shall be exterminated in the manner of the One World Government experiment carried out by Pol Pot in Cambodia. Euthanasia for the terminally ill and the aged shall be compulsory. No cities shall be larger than a predetermined number as described in the work of Kalgeri. Essential workers will be moved to other cities if the one they are in becomes overpopulated. Other non-essential workers will be chosen at random and sent to underpopulated cities to fill “quotas.” At least 4 billion “useless eaters” shall be eliminated by the year 2050 by means of limited wars, organized epidemics of fatal rapid-acting diseases and starvation. Energy, food and water shall be kept at subsistence levels for the non-elite, starting with the White populations of Western Europe and North America and then spreading to other races. The population of Canada, Western Europe and the United States will be decimated more rapidly than on other continents, until the world’s population reaches a manageable level of 1 billion, of which 500 million will consist of Chinese and Japanese races, selected because they are people who have been regimented for centuries and who are accustomed to obeying authority without question. From time to time there shall be artificially contrived food and water shortages and medical care to remind the masses that their very existence depends on the goodwill of the Committee of 300. After the destruction of housing, auto, steel and heavy goods industries, there shall he limited housing, and industries of any kind allowed to remain shall be under the direction of NATO’s Club of Rome as shall all scientific and space exploration development, limited to the elite under the control of the Committee of 300. Space weapons of all former nations shall be destroyed along with nuclear weapons. All essential and non-essential pharmaceutical products, doctors, dentists and health care workers will be registered in the central computer data bank and no medicine or medical care will he prescribed without express permission of regional controllers responsible for each city, town and village. The United States will be flooded by peoples of alien cultures who will eventually overwhelm America, people with no concept of what the United States Constitution stands for and who will, in consequence, do nothing to defend it, and in whose minds the concept of liberty and justice is so weak as to matter little. Food and shelter shall be the main concern. No central bank save the Bank of International Settlement and the World Bank shall be allowed to operate. Private banks will be outlawed. Remuneration for work performed shall be under a uniform predetermined scale throughout the One World Government. There shall be no wage disputes allowed, nor any diversion from the standard uniform scales of pay laid down by the One World Government. Those who break the law will be instantly executed. There shall be no cash or coinage in the hands of the non- elite. All transactions shall be carried out by means of digital currency which shall bear the identification number of the holder. Any person who in any way infringes the rules and regulations of the Committee of 300 shall have the use of his or her digital currency suspended for varying times according to the nature and severity of the infringement. Such persons will find, when they go to make purchases, that their digital currency is blacklisted and they will not be able to obtain services of any kind. Attempts to trade “old” coins, that is to say silver coins of previous and now defunct nations, shall be treated as a capital crime subject to the death penalty. All such coinage shall be required to be surrendered within a given time along with guns, rifles, explosives and automobiles. Only the elite and One World Government high-ranking functionaries will be allowed private transport, weapons, coinage and automobiles. If the offense is a serious one, the digital currency will be shut off at the checking point where it is presented. Thereafter that person shall not be able to obtain food, water, shelter and employment medical services, and shall be officially listed as an outlaw. Large bands of outlaws will thus be created and they will live in regions that best afford subsistence, subject to being hunted down and shot on sight. Persons assisting outlaws in any way whatsoever, shall likewise be shot. Outlaws who fail to surrender to the police or military after a declared period of time, shall have a former family member selected at random to serve prison terms in their stead. Rival factions and groups such as Arabs and Jews and African tribes shall have differences magnified and allowed to wage wars of extermination against each other under the eyes of NATO and U.N. observers. The same tactics will be used in Central and South America. These wars of attrition shall take place before the take-over of the One World Government and shall be engineered on every continent where large groups of people with ethnic and religious differences live, such as the Sikhs, Moslem Pakistanis and the Hindu Indians. Ethnic and religious differences shall be magnified and exacerbated and violent conflict as a means of “settling” their differences shall be encouraged and fostered. All information services and print media shall be under the control of the One World Government. Regular brainwashing control measures shall be passed off as “entertainment” in the manner in which it was practiced and became a fine art in the United States. Youths removed from “disloyal parents,” shall receive special education designed to brutalize them. Youth of both sexes shall receive training to qualify as prison guards for the One World labor camp system. The above was written in 1991 by Dr. John Coleman. Dr. John Coleman was an Intelligence Officer for over 45 years and his book of truth is based on 20 years of relentless research. We can already see many of these things happening today. The Committee of 300 has already penetrated and subverted all governments through the World Economic Forum and United Nations to destroy the sovereign integrity of the nations represented by them. The Committee of 300 has already taken control of the education system in America with the intent and purpose of utterly and completely destroying it. They have now targeted our innocent children through homosexuality, transgenderism and pedophilia. They operate and control the world’s Pedophile systems. The Committee of 300 must come to its swift end. They are in control of America right now and are the ones who orchestrated the fraudulent 2020 Election and put corrupt Biden in the White House. They will not allow Trump or Kennedy to be President of the United States. We must do what must be done. We must end the Committee of 300 once and for all for the sake of our innocent children and for the sake of all humanity. These are their names. These are the people that want to eliminate you and control you. These are the people who have been ruling our world for over 150 years through death and chaos inflicted upon billions of innocent people. These are the same people creating world wars for profits and deaths. These are the people behind engineered viruses and diseases that were released upon the world killing millions. These are the people that must be removed from our world. PAST AND PRESENT MEMBERS OF THE COMMITTEE OF 300 AS OF 1991: BILL GATES IS A NEW MEMBER Abergavemy, Marquis of. Acheson, Dean. Adeane, Lord Michael. Agnelli, Giovanni. Alba, Duke of. Aldington, Lord. Aleman, Miguel. Allihone, Professor T. E. Alsop Family Designate. Amory, Houghton. Anderson, Charles A. Anderson, Robert 0. Andreas, Dwayne. Asquith, Lord. Astor, John Jacob and successor, Waldorf. Aurangzeb, Descendants of. Austin, Paul. Baco, Sir Ranulph BalFour, Arthur. Balogh, Lord. Bancroft, Baron Stormont. Baring. Barnato, B. Barran, Sir John. Baxendell, Sir Peter. Beatrice of Savoy, Princess. Beaverbrook, Lord. Beck, Robert. Beeley, Sir Harold. Beit, Alfred. Benn, Anthony Wedgewood. Bennet, John W. Benneton, Gilberto or alternate Carlo. Bertie, Andrew. Besant, Sir Walter. Bethal, Lord Nicholas. Bialkin, David. Biao, Keng. Bingham, William. Binny, J. F. Blunt, Wilfred. Bonacassi, Franco Orsini. Bottcher, Fritz. Bradshaw, Thornton. Brandt, Willy. Brewster, Kingman. Buchan, Alastair. Buffet, Warren. Bullitt, William C. Bulwer-Lytton, Edward. Bundy, McGeorge. Bundy, William. Bush, George. Cabot, John. Family Designate. Caccia, Baron Harold Anthony. Cadman, Sir John. Califano, Joseph. Carrington, Lord. Carter, Edward. Catlin, Donat. Catto, Lord. Cavendish, Victor C. W. Duke of Devonshire. Chamberlain, Houston Stewart. Chang, V. F. Chechirin, Georgi or Family Designate. Churchill, Winston. Cicireni, V. or Family Designate. Cini, Count Vittorio. Clark, Howard. Cleveland, Amory. Cleveland, Harland. Clifford, Clark. Cobold, Lord. Coffin, the Rev William Sloane. Constanti, House of Orange. Cooper, John. Family Designate. Coudenhove-Kalergi, Count. Cowdray, Lord. Cox, Sir Percy. Cromer, Lord Evelyn Baring. Crowther, Sir Eric. Cumming, Sir Mansfield. Curtis, Lionel. d’Arcy, William K. D’Avignon, Count Etienne. Danner, Jean Duroc. Davis, John W. de Benneditti, Carlo. De Bruyne, Dirk. De Gunzberg, Baron Alain. De Lamater, Major General Walter. De Menil, Jean. De Vries, Rimmer. de Zulueta, Sir Philip. de’Aremberg, Marquis Charles Louis. Delano. Family Designate. Dent, R. Deterding, Sir Henri. di Spadaforas, Count Guitierez, (House Douglas-Home, Sir Alec. Drake, Sir Eric. Duchene, Francois. DuPont. Edward, Duke of Kent. Eisenberg, Shaul. Elliott, Nicholas. Elliott, William Yandel. Elsworthy, Lord. Farmer, Victor. Forbes, John M. Foscaro, Pierre. France, Sir Arnold. Fraser, Sir Hugh. Frederik IX, King of Denmark Family Designate. Freres, Lazard. Frescobaldi, Lamberto. Fribourg, Michael. Gabor, Dennis. Gallatin, Albert. Family Designate. Gardner, Richard. Gates, William Henry III Geddes, Sir Auckland. Geddes, Sir Reay. George, Lloyd. Giffen, James. Gilmer, John D. Giustiniani, Justin. Gladstone, Lord. Gloucestor, The Duke of. Gordon, Walter Lockhart. Grace, Peter J. Greenhill, Lord Dennis Arthur. Greenhill, Sir Dennis. Grey, Sir Edward. Gyllenhammar, Pierres. Haakon, King of Norway. Haig, Sir Douglas. Hailsham, Lord. Haldane, Richard Burdone. Halifax, Lord. Hall, Sir Peter Vickers. Hambro, Sir Jocelyn. Hamilton, Cyril. Harriman, Averill. Hart, Sir Robert. Hartman, Arthur H. Healey, Dennis. Helsby, Lord. Her Majesty Queen Elizabeth II. Her Majesty Queen Juliana. Her Royal Highness Princess Beatrix. Her Royal Highness Queen Margreta. Heseltine, Sir William. Hesse, Grand Duke descendants, Family Designate. Hoffman, Paul G. Holland, William. House of Braganza. House of Hohenzollern. House, Colonel Mandel. Howe, Sir Geoffrey. Hughes, Thomas H. Hugo, Thieman. Hutchins, Robert M. Huxley, Aldous. Inchcape, Lord. Jamieson, Ken. Japhet, Ernst Israel. Jay, John. Family Designate. Keynes, John Maynard. Jodry, J. J. Joseph, Sir Keith. Katz, Milton. Kaufman, Asher. Keith, Sir Kenneth. Keswick, Sir William Johnston, or Keswick, H.N.L. Keswick, William Johnston. Kimberly, Lord. King, Dr. Alexander. Kirk, Grayson L. Kissinger, Henry. Kitchener, Lord Horatio. Kohnstamm, Max. Korsch, Karl. Lambert, Baron Pierre. Lawrence, G. Lazar. Lehrman, Lewis. Lever, Sir Harold. Lewin, Dr. Kurt. Lippmann, Walter. Livingstone, Robert R. Family Designate. Lockhart, Bruce. Lockhart, Gordon. Linowitz, S. Loudon, Sir John. Luzzatto, Pieipaolo. Mackay, Lord, of Clasfern. Mackay-Tallack, Sir Hugh. Mackinder, Halford. MacMillan, Harold. Matheson, Jardine. Mazzini, Gueseppi. McClaughlin, W. E. McCloy, John J. McFadyean, Sir Andrew. McGhee, George. McMillan, Harold. Mellon, Andrew. Mellon, William Larimer or Family Designate. Meyer, Frank. Michener, Roland. Mikovan, Anastas. Milner, Lord Alfred. Mitterand, Francois. Monett, Jean. Montague, Samuel. Montefiore, Lord Sebag or Bishop Hugh. Morgan, John P. Mott, Stewart. Mountain, Sir Brian Edward. Mountain, Sir Dennis. Mountbatten, Lord Louis. Munthe, A., or family designate. Naisbitt, John. Neeman, Yuval. Newbigging, David. Nicols, Lord Nicholas of Bethal. Norman, Montague. O’Brien of Lotherby, Lord. Ogilvie, Angus. Okita, Saburo. Oldfield, Sir Morris. Oppenheimer, Sir Earnest, and successor, Harry. Ormsby Gore, David (Lord Harlech). Orsini, Franco Bonacassi. Ortolani. Umberto. Ostiguy, J.P.W. Paley, William S. Pallavacini. Palme, Olaf. Palmerston. Palmstierna, Jacob. Pao, Y.K. Pease, Richard T. Peccei, Aurellio. Peek, Sir Edmund. Pellegreno, Michael, Cardinal. Perkins, Nelson. Pestel, Eduard. Peterson, Rudolph. Petterson, Peter G. Petty, John R. Philip, Prince, Duke of Edinburgh. Piercy, George. Pinchott, Gifford. Pratt, Charles. Price Waterhouse, Designate. Radziwall. Ranier, Prince. Raskob, John Jacob. Recanati. Rees, John Rawlings. Rees, John. Rennie, Sir John. Rettinger, Joseph. Rhodes, Cecil John. Rockefeller, David. Role, Lord Eric of Ipsden. Rosenthal, Morton. Rostow, Eugene. Rothmere, Lord. Rothschild Elie de or Edmon de and/or Baron Rothschild Runcie, Dr. Robert. Russell, Lord John. Russell, Sir Bertrand. Saint Gouers, Jean. Salisbury, Marquisse de Robert Gascoiugne Cecil. Shelburne, The Salisbury, Lord. Samuel, Sir Marcus. Sandberg, M. G. Sarnoff, Robert. Schmidheiny, Stephan or alternate brothers Thomas, Alexander. Schoenberg, Andrew. Schroeder. Schultz, George. Schwartzenburg, E. Shawcross, Sir Hartley. Sheridan, Walter. Shiloach, Rubin. Silitoe, Sir Percy. Simon, William. Sloan, Alfred P. Smuts, Jan. Spelman. Sproull, Robert. Stals, Dr. C. Stamp, Lord Family designate. Steel, David. Stiger, George. Strathmore, Lord. Strong, Sir Kenneth. Strong, Maurice. Sutherland. Swathling, Lord. Swire, J. K. Tasse, G. Or Family Designate. Temple, Sir R. Thompson, William Boyce. Thompson, Lord. Thyssen-Bornamisza, Baron Hans Henrich. Trevelyn, Lord Humphrey. Turner, Sir Mark. Turner, Ted. Tyron, Lord. Urquidi, Victor. Van Den Broek, H. Vanderbilt. Vance, Cyrus. Verity, William C. Vesty, Lord Amuel. Vickers, Sir Geoffrey. Villiers, Gerald Hyde family alternate. Volpi, Count. von Finck, Baron August. von Hapsburg, Archduke Otto, House of Hapsburg-Lorraine. Von Thurn and Taxis, Max. Wallenberg, Peter or Family Designate. Wang, Kwan Cheng, Dr. Warburg, S. C. Ward Jackson, Lady Barbara. Warner, Rawleigh. Warnke, Paul. Warren, Earl. Watson, Thomas. Webb, Sydney. Weill, David. Weill, Dr. Andrew. Weinberger, Sir Caspar. Weizman, Chaim. Wells, H. G. Wheetman, Pearson (Lord Cowdray). White, Sir Dick Goldsmith. Whitney, Straight. Wiseman, Sir William. Wittelsbach. Wolfson, Sir Isaac. Wood, Charles. Young, Owen. Most Presidents and Prime Ministers around the world are controlled and were installed by the Committee of 300. There are thousands of people such as Klaus Schwab, leader of the World Economic Forum who work for the Committee of 300 to accomplish their will and purpose but are not direct members of the Committee of 300. They too must be removed from our society. The Committee of 300 also controls all the intelligence agencies such as MI6 and the CIA which are their most powerful tools to accomplish their goals worldwide. To restore America and humanity we must do away with the Committee of 300. This is the head of the snake that must be cut off. It will take a global effort of bravery and action. It must be done or we will lose America and the rest of the world to a future of global tyranny. They have already killed millions of innocent people and plan on killing billions more. They are coming after our children, they are sexualizing them and want to legalize Pedophilia. They will not stop unless we physically stop them by force. This is the reality of humanities fate. Criminals and mass murderers do not surrender their power. It must be taken from them for the sake of all humanity. They think they are gods themselves, the Olympians who have the right to decide who lives and who dies. They are gravely mistaken and their rule must come to a swift end.

Davos and WEF Forum

https://youtu.be/3Zs0sp36AGs

Some Favorite Pics I Shared. Jorma A Jyrkkanen, BSc, PDP, RWR Pfc-1st Class

June 5, 2023

Antibiotics, Vaccines, Polio, Viruses, Autoimmune Diseases, Bioterrorism-cont. Dr Tent Blows the Lid. 2023-06-03. Jorma A Jyrkkanen, BSc, PDP, Analyst

June 3, 2023
Antibiotics came out in 1942. In 1943 Polio broke out and kids were being paralyzed. What was in the vaccines that was causing polio? Monkey viruses were the prime suspect. His story is all about vaccines having all kinds of viruses that cause cancer and other diseases. In 1955 a polio vaccine was rushed into production. They put formaldehyde into the vaccine. Dr. Bernice Eddy said it should be tested first. They did on Monkeys and they became paralyzed. Kids got sick from polio vaccine and were paralyzed. The polio vaccine never stopped polio. Better sanitation stopped it.

Deadly Viruses Were Being Disseminated in Vaccines

Inner Connections>Welcome to Inner Connections>Cafe>Cafe, Fun Things Archived>

The Exploding Autoimmune Epidemic – Dr. Tent – It’s Not Autoimmune, you have Viruses.
Crochet Sue IC Angel

Jan 29, 2013#1
The Exploding Autoimmune Epidemic – Dr. Tent – It’s Not Autoimmune, you have Viruses.
This is about vaccines, they contain viruses that cause all kinds of diseases.
I am watching this video and it is very interesting. It’s 2 hrs long and I realize most do not have the time to watch it so I’m taking notes. I was taking notes for one of my sisters, and decided to post them here too. I have only watched
a half hour so far and will post the notes I took below. I will post more as I watch it, which I won’t be watching anymore tonight, but over the next few days.
In this first half hour he is talking about the vaccines causing cancer. He hasn’t talked about vaccines causing autoimmune diseases yet. I am interested to get to that part as scleroderma, which Gabby had, {I Jorma Jyrkkanen have scleroderma and have had Polio vaccines as a kid in about 1951} is also an
autoimmune disease that starts out the same as arthritis but gets much worse when it attacks internal organs.

Jan 29, 2013#2
Notes from the first half hour:
They thought a virus was the cause of cancer in the early 50’s
In 1999 to 2001, 60 Minutes investigated this story and they put more money
and time into than any other story they ever aired. They said there is no way
they can air this so they didn’t.
1942 antibiotics were released, 1943 polio became an epidemic. Polo mimicked
the flu so people were treated with antibiotics when they really had polo
.
1955 a polo vaccine was rushed into productions. They put formaldeyde in
the vaccine. Dr. Bernice Eddy said they should test it first, she tried it on
monkeys and they were paralyzed. She tried to get them to halt the vaccine
but they did it anyway. Kids got sick from polio and were paralyzed.

The polo vaccine never stopped polio, it was stopped by people practicing
better santitation and refrigeration methods.
Dr. Eddy was taken off the polio research. She and Dr. Sarah Stewart discovered
that cancer is caused by a virus.

The vaccine manufacturers were growing their polio viruses on the kidneys
of monkeys and when they removed the polio virus from the monkey kidneys
they also removed an unknown number of other monkey viruses with it.
In 1959 Dr. Bernice Eddy found overwhelming evidence that they had just
inoculated an entire generation with cancer-causing monkey viruses.
She predicted an epidemic of cancer. There is 40 monkey viruses in
the vaccines. [JJ comment: SV40 is the culprit we now know]
The government made it classified and would no longer allow information
about it out to the public. Everyone still has these viruses from the vaccines inside of them. If you get
a blood sample analyzed they would find these viruses in it.

In 1960 Dr. Bernice Eddy gave a talk to the New York Cancer Society and announced
that she examined the monkey kidney cells in which the polio virus was grown and
found they were infected with cancer-causing viruses, SV-40.
They crushed Bernice Eddy professionally. They took away her lab, destroyed
her animals, put her under a gag order and delayed publication of her scientific
papers.
In 1961 federal regulations went into effect that required that the polio vaccines
be free of SV40 but they did NOT require the SV40 contaminated seeds used to
make every batch or lot of vaccine be discarded nor the recently manufactured
contaminated vaccines be discarded. They continued giving the contaminated
vaccines to children and adults until they were used up sometime in 1963.
In 1962 Sabin Oral Polio vaccine is introduced but they used the same culture
medium, the monkey kidneys. This was the vaccine put into the sugar cube
that everyone took back then. It is estimated that 1 out of every 200 people
are getting cancer caused by SV40.

They started to realize that cancers rarely seen such as lung, breast, prostate,
lymphoma, brain and melanoma increased 50% over a 16 year period. Lung
cancer is rising because the vaccine is causing it, not smoking. As smoking has
gone down, lung cancer has gone up.

The vaccine developers did not want to release this information. They said it
would scare the public unnecessarily. If they hear that their children were
injected with a cancer virus that would not be very good.
Men born between 1948 and 1957 have 3x as much cancer not related to smoking.
The study’s researchers insist the increase cannot be explained by smoking,
better diagnosis or an again population. Public Health Official, Devra Lee Davis
said “There’s something else going on here.”
The SV40 virus is also sexually transmitted and you can get it from a blood
transfusion and it is spread from mother to child even if they had never got the
vaccine shots. Those never inoculated with the contaminated vaccine inherits it
up from their parents and can pass it on or infect their children and grandchildren.
This information has been blacked out from history.

There is also a virus in the vaccine that acts like AIDS.
Robert Gallo’s group at the NCI and Litton Bionetics also experimented with other
simian and human cancer viruses (e.g., SV40), and developed recombinants (i.e. mutants)
of these with other viral nucleic acids including those that caused the prominent
features of AIDS — WBC dysfunction, leukemias, lymphomas, sarcomas,
progressive wasting, and ultimate death in cats, mice, chickens, and humans.

See also https://www.facebook.com/TruthIsTerrorism/videos/maurice-hilleman-was-responsible-for-developing-more-than-40-vaccines-including-/1955638617986347/

SV40 and HIV fragment found in covid-19 vaccines. This suggest bioterrorists are still using experience from the 1950s and 1960s to make people sick by producing epidemics and big profits for Big Pharma.

Pentagon Global Biowarfare Program. Liz Churchill. 2023-05-29. Analyst Jorma Jyrkkanen, BSc, PDP

May 29, 2023

https://twitter.com/i/status/1662566656432910339

Vote to Impeach Biden Passes

← Back

Thank you for your response. ✨

Wuhan Institute of Virology Shao Cao Admission Wuhan Lab Participated in the Search for Best ACE2 Adherent Spike for Weaponization

PERPETRATORS OF THIS HEINOUS CRIME AGAINST HUMANITY

My Summary

The covid-19 virus was designed to harm the immune system by attacking the mitochondrial contribution and the AIDS fragment was included to further attack the immune system. The SV40 fragment found by Japanese investigators is a cancer promoter and specifically can produce several cancers including the same one as asbestos. Loss of the mitochondria increases reactive oxygen and lipid peroxide the same as antibiotics and common pesticides. These are mutagens that can initiate many changes including but not limited to increasing the risk of cancer while loss of oxidative phosphorylation will increase aerobic glycolysis, the favorite respiration of cancer while also damaging the cardiovascular system because the heart is loaded with and mitochondria and needs them as an ATP energy source. You also lose short chain fatty acids which damages the immune system. Mitochondrial genes sustain the immune system and that contribution is diminished by their damage or loss. Data from a number of countries showed that deaths increased significantly after vaccinations. The mRNA experimental drugs are not a vaccine. They neither prevent infection or stop its spread. They don’t work because this virus mutates faster than we can make vaccines. This virus is a population reduction biowarfare agent designed to kill people and the vaccine is part of that mission. Administration of antibiotics to those sick with it may hasten their death. Please see: https://www.researchgate.net/publication/346505752_Antibiotic_induced_changes_to_mitochondria_result_in_potential_contributions_to_carcinogenesis_heart_pathologies_other_medical_conditions_and_ecosystem_risks

See my findings on mitochondria important in considering future side effects.

The Chief Architects of this Depravity

Obama, Biden, Hillary, Many others.

CBC Story on Manitoba Lvl IV Lab Suggest Canada Researching Bioweapons. Is this under contract to US DOD?

These Biological Weapons Revelations Changes Everything

These Revelations Change the Direction and Purpose of the Phony Proxy War from Protection of Sovereignty to Protection of Global Biological War Infrastructure and Perpetrators to Arresting them for Crimes against Humanity and Contributing to Ecocide for Trial at Nuremberg II.

SEE ALSO https://jormajyrkkanen.ca/2023/01/13/jorma-antero-jyrkkanens-bibliography-2022/

← Back

Thank you for your response. ✨

BigPharma Biggest Harma

https://twitter.com/i/status/1708585468479123516

Kennedy Writes Book on this Subject